অ্যাকচুয়াল প্যাটার্নস

প্যাটার্ন হলো গ্রাফিক্যাল মডেল, যা মূল্য ওঠানামার ভিত্তিতে চার্টে তৈরি হয়। টেকনিক্যাল বিশ্লেষণের নীতি অনুযায়ী, ইতিহাসের (প্রাইস মুভমেন্ট) পুনরাবৃত্তি ঘটে। অর্থাৎ, পরিস্থিতি যদি একই রকম থাকে তাহলে প্রাইস মুভমেন্টও প্রায় একই রকম হয়। এর ফলে মূল্যের ওঠানামা কেমন হবে তা আগেই থেকেই অনুমান করা যায়।
ইন্সটাফরেক্স এর প্রাসঙ্গিক প্যাটার্নসমূহ সহজেই ব্যবহার করা যায়, যার মাধ্যমে মার্কেটের সর্বশেষ পরিস্থিতি জানা যায় এবং তার উপর ভিত্তি করে সিদ্ধান্ত নেওয়া যায়। আমাদের সেবাগুলো থেকে আপনি যেকোনো পেয়ার এবং টাইমফ্রেমের জন্য সর্বশেষ এবং সবচেয়ে প্রাসঙ্গিক প্যাটার্নগুলো খুঁজে পাবেন।
Bullish Symmetrical Triangle
was formed on 25.03 at 05:57:23 (UTC+0)
signal strength 4 of 5
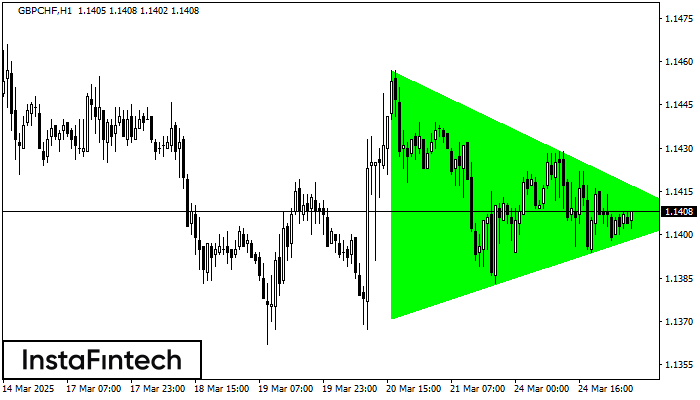
According to the chart of H1, GBPCHF formed the Bullish Symmetrical Triangle pattern. Description: This is the pattern of a trend continuation. 1.1457 and 1.1371 are the coordinates of the upper and lower borders respectively. The pattern width is measured on the chart at 86 pips. Outlook: If the upper border 1.1457 is broken, the price is likely to continue its move by 1.1446.
আরও দেখুন
- All
- All
- Bearish Rectangle
- Bearish Symmetrical Triangle
- Bearish Symmetrical Triangle
- Bullish Rectangle
- Double Top
- Double Top
- Triple Bottom
- Triple Bottom
- Triple Top
- Triple Top
- All
- All
- Buy
- Sale
- All
- 1
- 2
- 3
- 4
- 5
বিয়ারিশ পেন্যান্ট
was formed on 31.03 at 18:00:53 (UTC+0)
signal strength 3 of 5

M30 চার্টে #NTDOY-এর বিয়ারিশ পেন্যান্ট প্যাটার্ন গঠিত হয়েছে৷ এই প্যাটার্নের ধরনটি সামান্য মন্থরতা দ্বারা চিহ্নিত করা হয় যার পরে মূল্য মূল প্রবণতার দিকে চলে যাবে। প্যাটার্নের সর্বনিম্ন 16.77 এর নীচে
Open chart in a new window
বিয়ারিশ পেন্যান্ট
was formed on 31.03 at 18:00:41 (UTC+0)
signal strength 3 of 5

M30 চার্টে #NTDOY-এর বিয়ারিশ পেন্যান্ট প্যাটার্ন গঠিত হয়েছে৷ এটি বিদ্যমান প্রবণতার সম্ভাব্য ধারাবাহিকতার ইঙ্গিত দেয়। স্পেসিফিকেশন: প্যাটার্নের নীচে 16.77 কোঅর্ডিনেশন রয়েছে; ফ্ল্যাগপোলের উচ্চতার প্রজেকশন 126 পিপসের সমান। যদি এই প্যাটার্নের
Open chart in a new window
ডাবল টপ
was formed on 31.03 at 17:35:11 (UTC+0)
signal strength 1 of 5
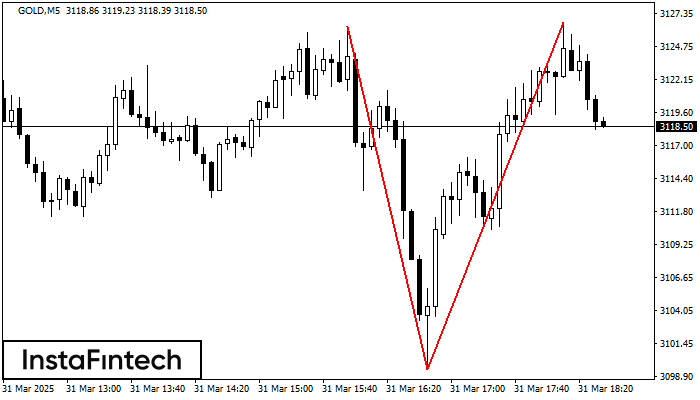
M5 চার্টে, GOLD-এর ডাবল টপ প্যাটার্নটি গঠিত হয়েছে। এটি এই ইঙ্গিত দেয় যে চলমান প্রবণতা ঊর্ধ্বমুখী থেকে নিম্নমুখীতে পরিবর্তিত হয়েছে। সম্ভবত, যদি 3099.42 প্যাটার্নের ভিত্তিটি ব্রেক করা হয়, তাহলে নিম্নমুখী
M5 এবং M15 টাইম ফ্রেমে আরও ভুল এন্ট্রি পয়েন্ট থাকতে পারে।
Open chart in a new window