

অ্যাকচুয়াল প্যাটার্নস

প্যাটার্ন হলো গ্রাফিক্যাল মডেল, যা মূল্য ওঠানামার ভিত্তিতে চার্টে তৈরি হয়। টেকনিক্যাল বিশ্লেষণের নীতি অনুযায়ী, ইতিহাসের (প্রাইস মুভমেন্ট) পুনরাবৃত্তি ঘটে। অর্থাৎ, পরিস্থিতি যদি একই রকম থাকে তাহলে প্রাইস মুভমেন্টও প্রায় একই রকম হয়। এর ফলে মূল্যের ওঠানামা কেমন হবে তা আগেই থেকেই অনুমান করা যায়।
ইন্সটাফরেক্স এর প্রাসঙ্গিক প্যাটার্নসমূহ সহজেই ব্যবহার করা যায়, যার মাধ্যমে মার্কেটের সর্বশেষ পরিস্থিতি জানা যায় এবং তার উপর ভিত্তি করে সিদ্ধান্ত নেওয়া যায়। আমাদের সেবাগুলো থেকে আপনি যেকোনো পেয়ার এবং টাইমফ্রেমের জন্য সর্বশেষ এবং সবচেয়ে প্রাসঙ্গিক প্যাটার্নগুলো খুঁজে পাবেন।
Bearish pennant
was formed on 31.03 at 18:00:41 (UTC+0)
signal strength 3 of 5

The Bearish pennant pattern has formed on the #NTDOY M30 chart. It signals potential continuation of the existing trend. Specifications: the pattern’s bottom has the coordinate of 16.77; the projection of the flagpole height is equal to 126 pips. In case the price breaks out the pattern’s bottom of 16.77, the downtrend is expected to continue for further level 16.47.
আরও দেখুন
- All
- All
- Bearish Rectangle
- Bearish Symmetrical Triangle
- Bearish Symmetrical Triangle
- Bullish Rectangle
- Double Top
- Double Top
- Triple Bottom
- Triple Bottom
- Triple Top
- Triple Top
- All
- All
- Buy
- Sale
- All
- 1
- 2
- 3
- 4
- 5
Bearish Symmetrical Triangle
was formed on 21.04 at 12:20:58 (UTC+0)
signal strength 1 of 5

According to the chart of M5, GBPCHF formed the Bearish Symmetrical Triangle pattern. Trading recommendations: A breach of the lower border 1.0783 is likely to encourage a continuation
The M5 and M15 time frames may have more false entry points.
Open chart in a new window
Triple Bottom
was formed on 21.04 at 12:15:45 (UTC+0)
signal strength 2 of 5

The Triple Bottom pattern has formed on the chart of USDJPY M15. Features of the pattern: The lower line of the pattern has coordinates 140.99 with the upper limit 140.99/140.92
The M5 and M15 time frames may have more false entry points.
Open chart in a new window
Bullish Rectangle
was formed on 21.04 at 12:13:34 (UTC+0)
signal strength 1 of 5
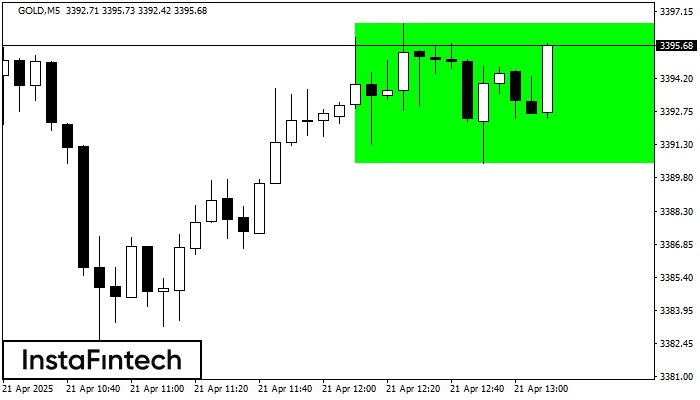
According to the chart of M5, GOLD formed the Bullish Rectangle. This type of a pattern indicates a trend continuation. It consists of two levels: resistance 3396.64 and support 3390.42
The M5 and M15 time frames may have more false entry points.
Open chart in a new window


