

Các mẫu thực tế

Các mẫu là các mô hình đồ họa được hình thành trong biểu đồ theo giá. Theo một trong những định đề phân tích kỹ thuật, lịch sử (chuyển động giá) thường tự lặp lại. Có nghĩa là biến động giá thường giống nhau trong các tình huống giống nhau, do đó có thể dự đoán chuyển động tiếp theo của tình huống với xác suất cao.
Các mẫu hữu quan của InstaTrade là một dịch vụ dễ sử dụng cho phép bạn nhận biết được những thay đổi mới nhất trên thị trường và phản ứng kịp thời với các dấu hiệu từ thị trường. Trong dịch vụ của chúng tôi, bạn sẽ luôn tìm thấy các mẫu mới nhất và phù hợp nhất trên bất kỳ cặp nào và bất kỳ khung thời gian nào.
Bullish Symmetrical Triangle
was formed on 25.03 at 07:05:25 (UTC+0)
signal strength 1 of 5

According to the chart of M5, AUDUSD formed the Bullish Symmetrical Triangle pattern, which signals the trend will continue. Description. The upper border of the pattern touches the coordinates 0.6295/0.6288 whereas the lower border goes across 0.6279/0.6288. The pattern width is measured on the chart at 16 pips. If the Bullish Symmetrical Triangle pattern is in progress during the upward trend, this indicates the current trend will go on. In case 0.6288 is broken, the price could continue its move toward 0.6303.
The M5 and M15 time frames may have more false entry points.
Xem thêm
- All
- All
- Bearish Rectangle
- Bearish Symmetrical Triangle
- Bearish Symmetrical Triangle
- Bullish Rectangle
- Double Top
- Double Top
- Triple Bottom
- Triple Bottom
- Triple Top
- Triple Top
- All
- All
- Buy
- Sale
- All
- 1
- 2
- 3
- 4
- 5
Banderín bajista
was formed on 31.03 at 16:00:21 (UTC+0)
signal strength 1 of 5

El patrón Banderín bajista se ha formado en el gráfico #AMZN M5. Esto señala la continuación potencial de la tendencia existente. Especificaciones: el piso del patrón tiene la coordinada
Los marcos de tiempo M5 y M15 pueden tener más puntos de entrada falsos.
Open chart in a new window
Doble Techo
was formed on 31.03 at 16:00:13 (UTC+0)
signal strength 3 of 5
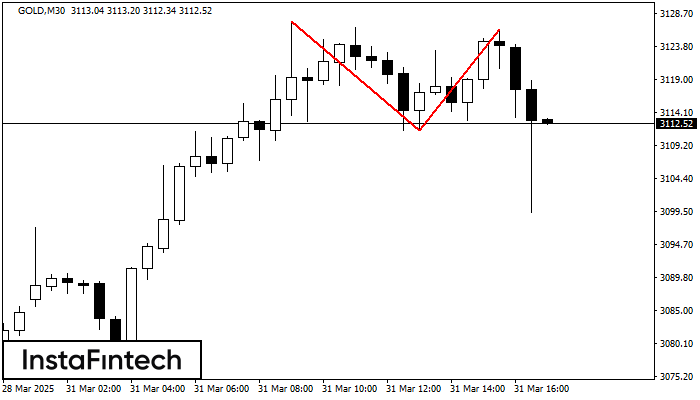
El patrón de reversión Doble Techo ha sido formado en GOLD M30. Características: el límite superior 3127.49; el límite inferior 3111.43; el ancho del patrón es 1491 puntos. Es mejor
Open chart in a new window
Doble Piso
was formed on 31.03 at 15:30:34 (UTC+0)
signal strength 1 of 5
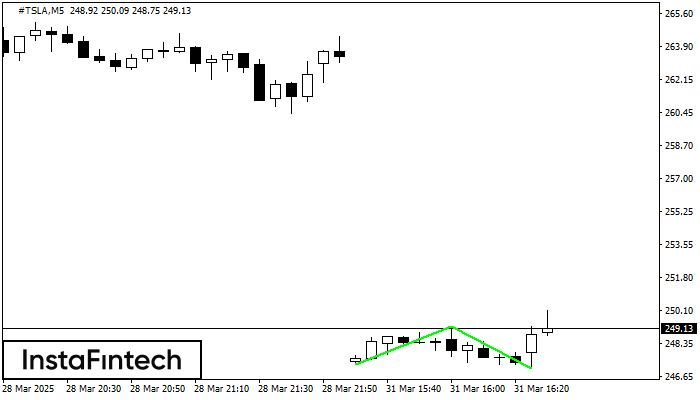
El patrón Doble Piso ha sido formado en #TSLA M5. Esta formación señala una reversión de la tendencia de bajista a alcista. La señal es que se debe abrir
Los marcos de tiempo M5 y M15 pueden tener más puntos de entrada falsos.
Open chart in a new window
