Dolzarb patternlar

Двойная вершина
сформирован 07.04 в 11:40:08 (UTC+0)
сила сигнала 1 из 5
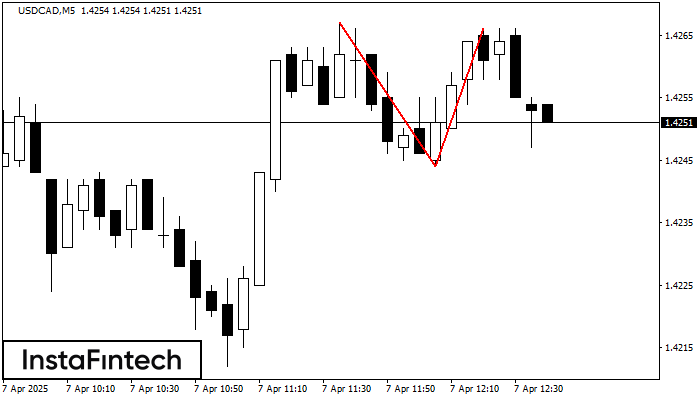
По USDCAD на M5 сформировалась разворотная фигура «Двойная вершина». Характеристика: Верхняя граница 1.4267; Нижняя граница 1.4244; Ширина фигуры 22 пунктов. Позицию на продажу возможно открыть ниже нижней границы 1.4244, с перспективой хода к уровню 1.4229.
Таймфреймы М5 и М15 могут иметь больше ложных точек входа.
- Все
- Все
- Bearish Rectangle
- Bearish Symmetrical Triangle
- Bearish Symmetrical Triangle
- Bullish Rectangle
- Double Top
- Double Top
- Triple Bottom
- Triple Bottom
- Triple Top
- Triple Top
- Все
- Все
- Покупка
- Продажа
- Все
- 1
- 2
- 3
- 4
- 5
Triple Bottom
сформирован 21.04 в 19:00:13 (UTC+0)
сила сигнала 1 из 5
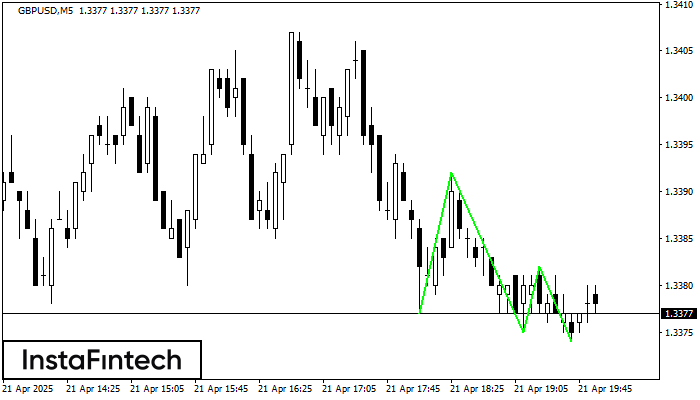
The Triple Bottom pattern has been formed on GBPUSD M5. It has the following characteristics: resistance level 1.3392/1.3382; support level 1.3377/1.3374; the width is 15 points. In the event
The M5 and M15 time frames may have more false entry points.
Открыть график инструмента в новом окне
Triple Bottom
сформирован 21.04 в 18:40:14 (UTC+0)
сила сигнала 1 из 5

The Triple Bottom pattern has formed on the chart of the #AMZN M5 trading instrument. The pattern signals a change in the trend from downwards to upwards in the case
The M5 and M15 time frames may have more false entry points.
Открыть график инструмента в новом окне
Double Bottom
сформирован 21.04 в 18:15:42 (UTC+0)
сила сигнала 2 из 5
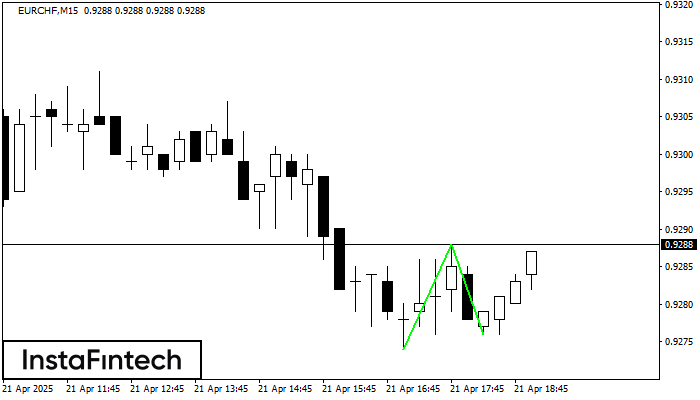
The Double Bottom pattern has been formed on EURCHF M15. This formation signals a reversal of the trend from downwards to upwards. The signal is that a buy trade should
The M5 and M15 time frames may have more false entry points.
Открыть график инструмента в новом окне