Dolzarb patternlar

Тройная вершина
сформирован 03.04 в 07:15:39 (UTC+0)
сила сигнала 2 из 5
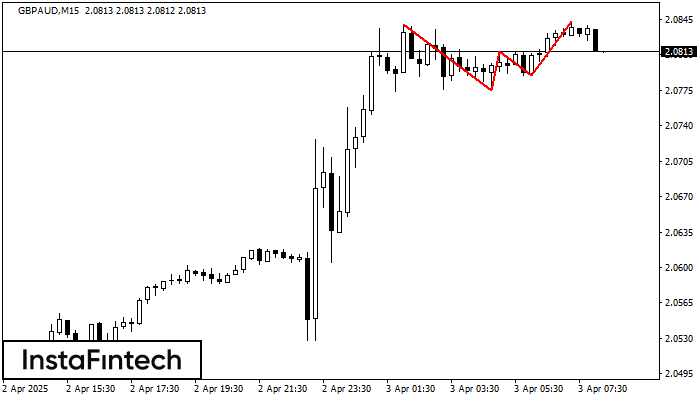
На графике GBPAUD M15 образовалась фигура «Тройная вершина». Данная фигура относится к типу разворотных и имеет характеристику: Верхняя граница 2.0840/2.0843; Нижняя граница 2.0775/2.0789; Ширина фигуры 24 пунктов. Прогноз: В случае пробоя нижней границы 2.0775 вероятно дальнейшее нисходящее движение к уровню 2.0791.
Таймфреймы М5 и М15 могут иметь больше ложных точек входа.
Shuningdek ko'ring
- Все
- Все
- Bearish Rectangle
- Bearish Symmetrical Triangle
- Bearish Symmetrical Triangle
- Bullish Rectangle
- Double Top
- Double Top
- Triple Bottom
- Triple Bottom
- Triple Top
- Triple Top
- Все
- Все
- Покупка
- Продажа
- Все
- 1
- 2
- 3
- 4
- 5
Bearish Rectangle
was formed on 17.04 at 01:35:04 (UTC+0)
signal strength 2 of 5
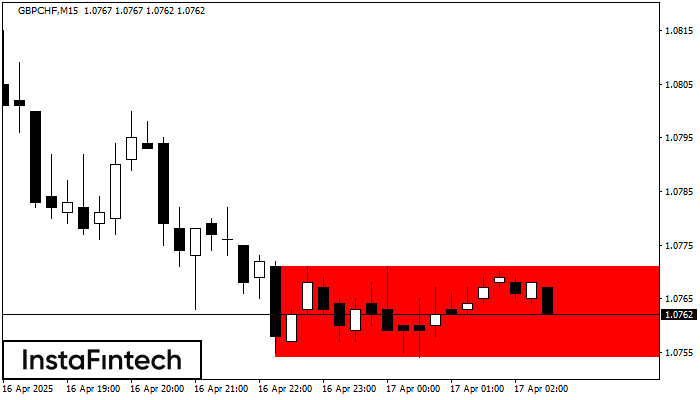
According to the chart of M15, GBPCHF formed the Bearish Rectangle. The pattern indicates a trend continuation. The upper border is 1.0771, the lower border is 1.0754. The signal means
The M5 and M15 time frames may have more false entry points.
Open chart in a new window
Bearish Rectangle
was formed on 17.04 at 01:12:52 (UTC+0)
signal strength 1 of 5
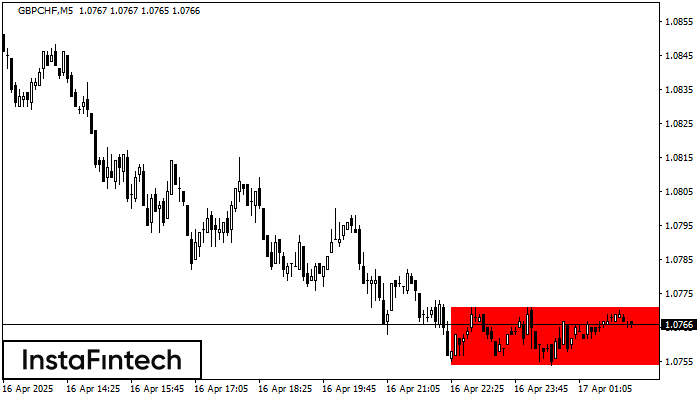
According to the chart of M5, GBPCHF formed the Bearish Rectangle. The pattern indicates a trend continuation. The upper border is 1.0771, the lower border is 1.0754. The signal means
The M5 and M15 time frames may have more false entry points.
Open chart in a new window
Bearish Rectangle
was formed on 17.04 at 01:06:37 (UTC+0)
signal strength 1 of 5
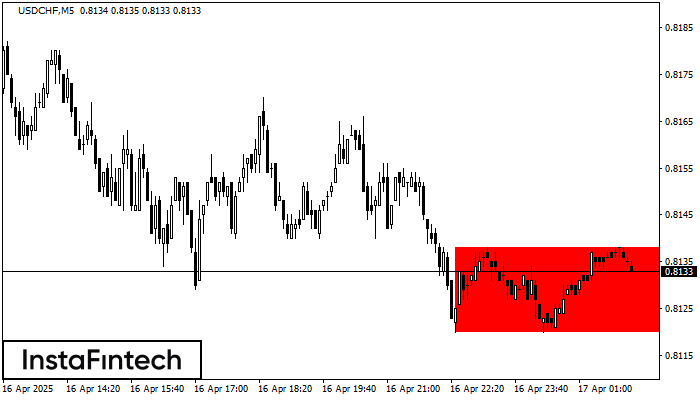
According to the chart of M5, USDCHF formed the Bearish Rectangle. The pattern indicates a trend continuation. The upper border is 0.8138, the lower border is 0.8120. The signal means
The M5 and M15 time frames may have more false entry points.
Open chart in a new window