Dolzarb patternlar

Двойное дно
сформирован 31.03 в 14:45:14 (UTC+0)
сила сигнала 2 из 5
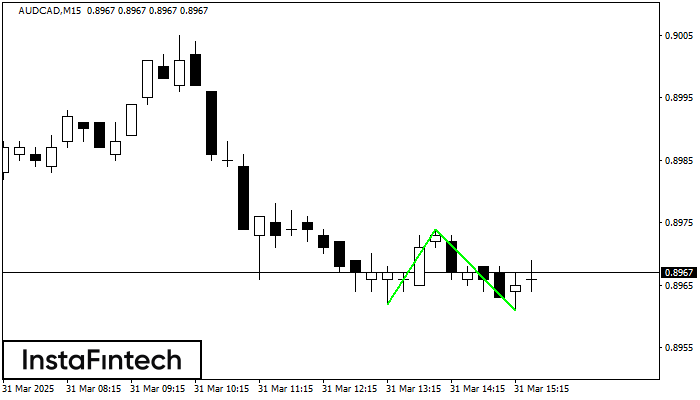
Сформирована фигура «Двойное дно» на графике AUDCAD M15. Характеристика: Уровень поддержки 0.8962; Уровень сопротивления 0.8974; Ширина фигуры 12 пунктов. В случае пробоя уровня сопротивления можно будет прогнозировать изменение тенденции, где первая точка фиксации прибыли находится на расстоянии 13 пунктов.
Таймфреймы М5 и М15 могут иметь больше ложных точек входа.
Shuningdek ko'ring
- Все
- Все
- Bearish Rectangle
- Bearish Symmetrical Triangle
- Bearish Symmetrical Triangle
- Bullish Rectangle
- Double Top
- Double Top
- Triple Bottom
- Triple Bottom
- Triple Top
- Triple Top
- Все
- Все
- Покупка
- Продажа
- Все
- 1
- 2
- 3
- 4
- 5
Double Bottom
was formed on 07.04 at 11:00:00 (UTC+0)
signal strength 3 of 5
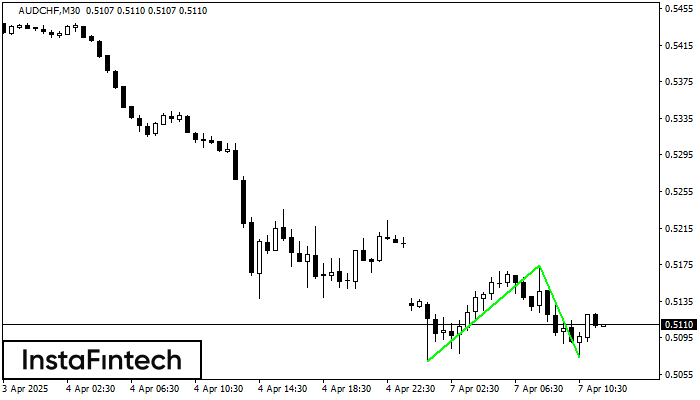
The Double Bottom pattern has been formed on AUDCHF M30. Characteristics: the support level 0.5069; the resistance level 0.5174; the width of the pattern 105 points. If the resistance level
Open chart in a new window
Head and Shoulders
was formed on 07.04 at 10:35:00 (UTC+0)
signal strength 1 of 5

The EURCAD M5 formed the Head and Shoulders pattern with the following features: The Head’s top is at 1.5734, the Neckline and the upward angle are at 1.5652/1.5644. The formation
The M5 and M15 time frames may have more false entry points.
Open chart in a new window
Double Bottom
was formed on 07.04 at 10:29:41 (UTC+0)
signal strength 3 of 5
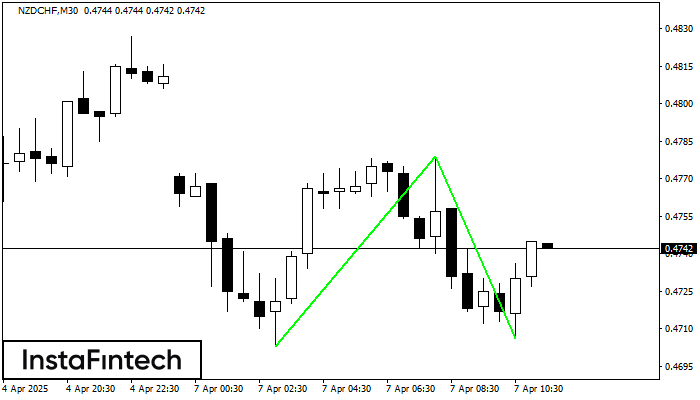
The Double Bottom pattern has been formed on NZDCHF M30. This formation signals a reversal of the trend from downwards to upwards. The signal is that a buy trade should
Open chart in a new window