

Dolzarb patternlar

Двойная вершина
сформирован 28.03 в 10:10:18 (UTC+0)
сила сигнала 1 из 5
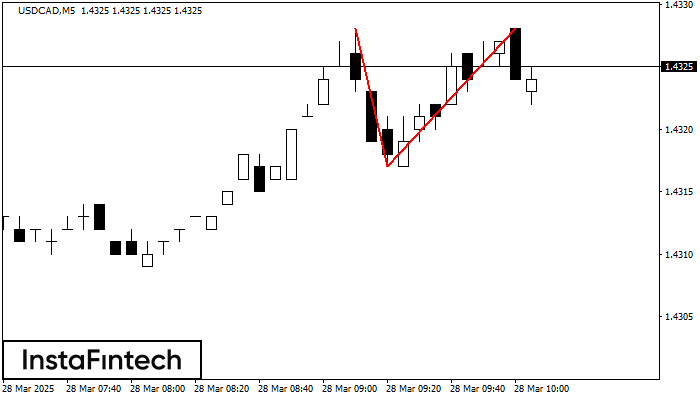
По USDCAD на M5 сформировалась разворотная фигура «Двойная вершина». Характеристика: Верхняя граница 1.4328; Нижняя граница 1.4317; Ширина фигуры 11 пунктов. Позицию на продажу возможно открыть ниже нижней границы 1.4317, с перспективой хода к уровню 1.4302.
Таймфреймы М5 и М15 могут иметь больше ложных точек входа.
Shuningdek ko'ring
- Все
- Все
- Bearish Rectangle
- Bearish Symmetrical Triangle
- Bearish Symmetrical Triangle
- Bullish Rectangle
- Double Top
- Double Top
- Triple Bottom
- Triple Bottom
- Triple Top
- Triple Top
- Все
- Все
- Покупка
- Продажа
- Все
- 1
- 2
- 3
- 4
- 5
Triple Bottom
was formed on 10.04 at 19:00:20 (UTC+0)
signal strength 4 of 5
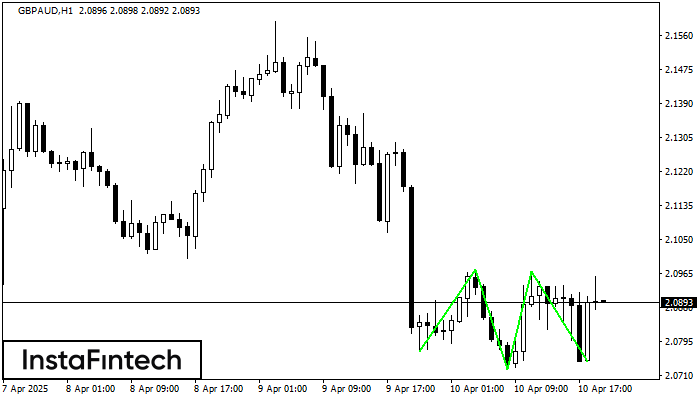
The Triple Bottom pattern has been formed on GBPAUD H1. It has the following characteristics: resistance level 2.0974/2.0969; support level 2.0768/2.0744; the width is 206 points. In the event
Open chart in a new window
Bearish Symmetrical Triangle
was formed on 10.04 at 18:50:38 (UTC+0)
signal strength 1 of 5
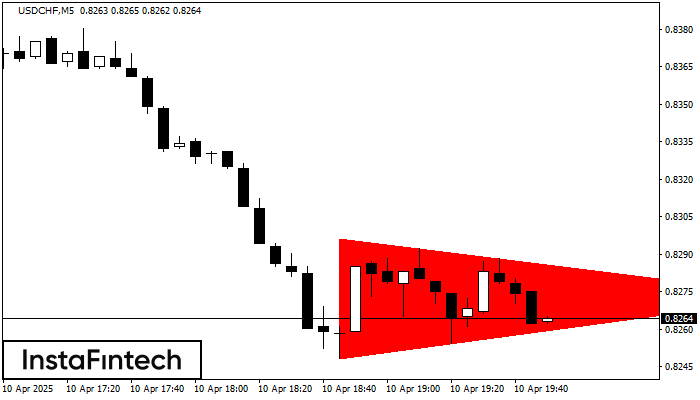
According to the chart of M5, USDCHF formed the Bearish Symmetrical Triangle pattern. Description: The lower border is 0.8248/0.8273 and upper border is 0.8296/0.8273. The pattern width is measured
The M5 and M15 time frames may have more false entry points.
Open chart in a new window
Double Bottom
was formed on 10.04 at 18:45:24 (UTC+0)
signal strength 1 of 5
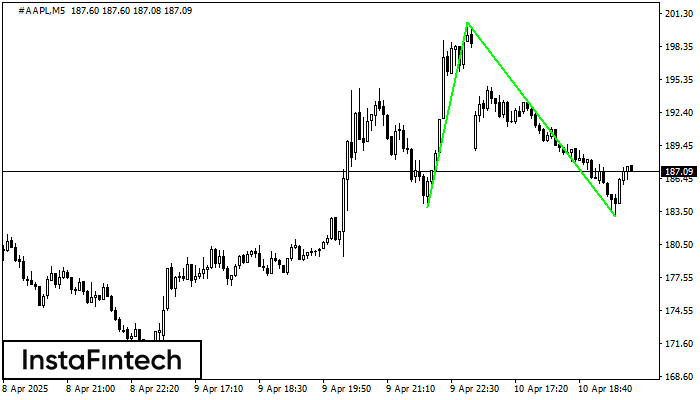
The Double Bottom pattern has been formed on #AAPL M5; the upper boundary is 200.55; the lower boundary is 183.02. The width of the pattern is 1666 points. In case
The M5 and M15 time frames may have more false entry points.
Open chart in a new window


