

รูปแบบกราฟ

รูปแบบกราฟนั้นเป็น รูปจำลองทางกราฟฟิกที่ถูกสร้างขึ้นมาในชาร์ตจากราคา อ้างอิงตามหนึ่งในการวิเคราะห์ทางเทคนิค ที่ตั้งสมมติฐานมาว่า ประวัติศาสตร์ (การเคลื่อนไหวของราคา) มักจะเกิดขึ้นซ้ำรอยเดิม นั้นหมายความว่า การเคลื่อนไหวของราคาก็หมือนกับ สถานการณ์หนึ่งที่จะสามารถทำการคาดการณ์ไปยังทิศทางในอนาคต ตามเหตุการณ์ที่น่าจะมีความเป็นไปได้สูง
รูปแบบกราฟที่สำคัญจากทาง InstaTrade นั้นจะเป็นการบริการที่มีการใช้อย่างง่ายดาย ซึ่งจะช่วยให้คุณสามารถทราบถึงการเปลี่ยนแปลงล่าสุด ในตลาดได้ และสามารถรับมือกับข้อมูลจากทางตลาดได้ทันท่วงที ในการบริการของพวกเรานั้น คุณจะพบกับรูปแบบกราฟล่าสุดและมีความสำคัญมากที่สุดในทุกๆคู่สกุลเงิน และทุกๆขอบเขตเวลา
Triple Bottom
was formed on 28.03 at 20:05:31 (UTC+0)
signal strength 1 of 5
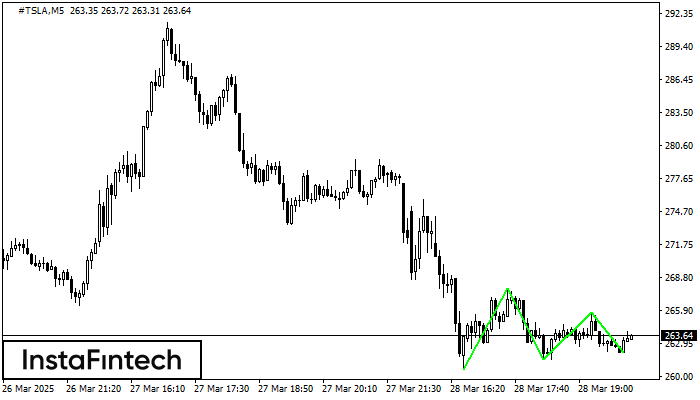
The Triple Bottom pattern has been formed on #TSLA M5. It has the following characteristics: resistance level 267.82/265.73; support level 260.65/262.15; the width is 717 points. In the event of a breakdown of the resistance level of 267.82, the price is likely to continue an upward movement at least to 261.68.
The M5 and M15 time frames may have more false entry points.
- All
- All
- Bearish Rectangle
- Bearish Symmetrical Triangle
- Bearish Symmetrical Triangle
- Bullish Rectangle
- Double Top
- Double Top
- Triple Bottom
- Triple Bottom
- Triple Top
- Triple Top
- All
- All
- Buy
- Sale
- All
- 1
- 2
- 3
- 4
- 5
รูปแบบกราฟจุดสามยอดขาลง (Triple Bottom)
was formed on 14.04 at 01:00:54 (UTC+0)
signal strength 4 of 5

รูปแบบ รูปแบบกราฟจุดสามยอดขาลง (Triple Bottom) ได้ถูกสร้างขึ้นมาใน USDCHF H1 มันมี คุณลักษณะ ดังต่อไปนี้: ระดับแนวต้าน 0.8256/0.8192; ระดับของแนวรับ 0.8140/0.8142; ความกว้างคือ
Open chart in a new window
รูปแบบกราฟจุดสองยอด (Double Top)
was formed on 14.04 at 00:45:17 (UTC+0)
signal strength 2 of 5

รูปแบบ รูปแบบกราฟจุดสองยอด (Double Top) ถูกสร้างขึ้นมาใน AUDCAD M15 มันแสดงให้เห็นว่า แนวโน้มได้มีการเปลี่ยนแปลงจากแนวโน้มขาขึ้น ไปเป็นขาลง บางที ถ้ามีการเคลื่อนตัวทะลุผ่าน ฐานของรูปแบบออกไป 0.8713 การเคลื่อนไหวลงด้านล่างจะยังคงเกิดขึ้น
ขอบเตระยะเวลาใน M5 และ M15 อาจจะมีตำแหน่งการเข้าใช้งานที่ผิดพลาดมากยิ่งขึ้น
Open chart in a new window
รูปแบบกราฟสี่เหลี่ยมผืนผ้าขาขึ้น (Bullish Rectangle)
was formed on 14.04 at 00:42:49 (UTC+0)
signal strength 1 of 5
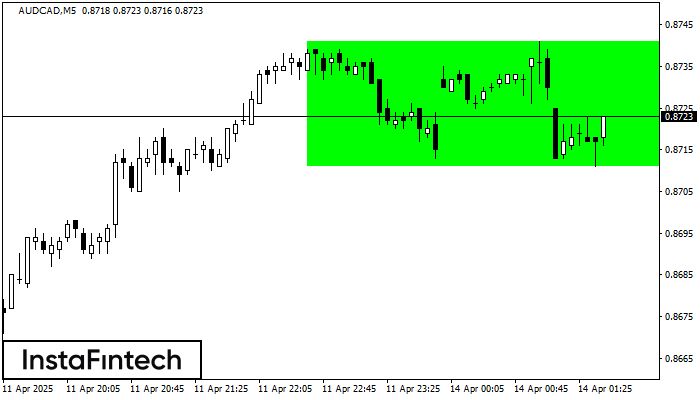
อ้างอิงจากชาร์ตของ M5, AUDCAD ที่ได้สร้างรูปแบบ รูปแบบกราฟสี่เหลี่ยมผืนผ้าขาขึ้น (Bullish Rectangle) ออกมา ซึ่งเป็นรูปแบบของความต่อเนื่องในแนวโน้ม รูปแบบนี้จะอยู่ในขอบเขตตามนี้: ขอบเขตด้านล่าง 0.8711 – 0.8711
ขอบเตระยะเวลาใน M5 และ M15 อาจจะมีตำแหน่งการเข้าใช้งานที่ผิดพลาดมากยิ่งขึ้น
Open chart in a new window


