See also


Triple top is reversal pattern consisting of three equal highs followed by a break below the support level.
The Triple Top and Triple Bottom patterns are the most effective and widely-used reversal formations. It is most appropriate to apply them at the moment of a trend reversal. The strategy is based on spotting a graphical figure at the moment when the price chart corresponds to the certain conditions.
We see the Triple Top pattern on the chart. It indicates a trend reversal. A trader can make profits, paying attention to support and resistance levels. Both the Triple Top and the Triple Bottom patterns are easily noticed on a chart. They are formed on minute and hour time frames. Thanks to the fact that these figures are easy to recognize, a reversal tendency enables traders to make timely decisions on closing deals in the right direction.
The strategy based on the Triple Top pattern is applied when the market is bullish. The pattern forms when prices attempt to break the resistance level three times in a row. If this level is not broken, then prices move lower towards the previous support level (a neckline), i.e. the trend reverses.
Beginners often confuse the Triple Top with the Double Top which is formed when prices approach the resistance level two times. It is better to wait a bit longer and see exactly what figure was formed rather than to give inaccurate forecasts and lose money.
The Triple Bottom pattern is formed when the market is bearish. It indicates that the market is likely to reverse downwards in the nearest future. Sometimes this figure resembles a candlestick with a long shadow and a short body crossing the support line. Newbies may get worried over this sign, but such behavior of a candlestick indicates that bulls took control over the market. The best moment for buy entries is when a candlestick is crossed or when the price hits the third level. In this case, a trader should set target at the resistance level.
Peaks of all highs are located almost on the same level. At the moment when the price rebounds from highs, lows of the three bottoms also move lower by one horizontal. If you have noticed the Triple Top, wait for the price to slide and pass through the neckline. It will indicate that the upward trend will reverse, i.e. it will become downward.
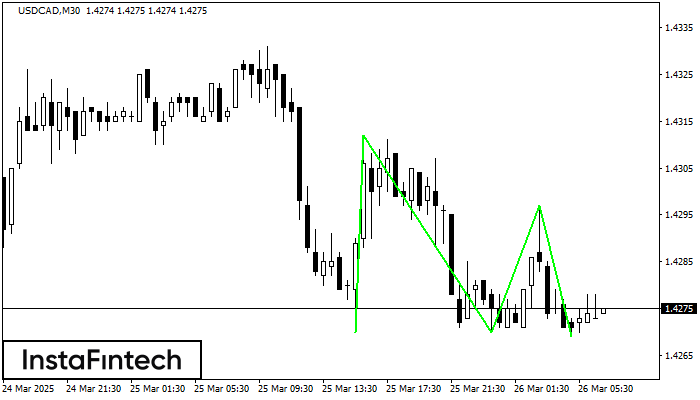
The Triple Bottom pattern has formed on the chart of USDCAD M30. Features of the pattern: The lower line of the pattern has coordinates 1.4312 with the upper limit 1.4312/1.4297
Open chart in a new window
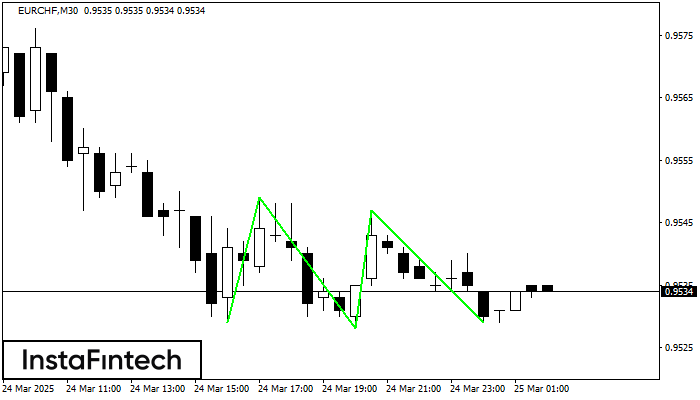
The Triple Bottom pattern has formed on the chart of the EURCHF M30 trading instrument. The pattern signals a change in the trend from downwards to upwards in the case
Open chart in a new window
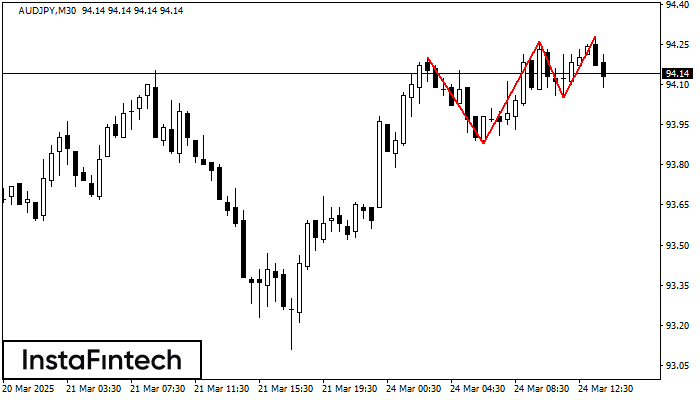
On the chart of the AUDJPY M30 trading instrument, the Triple Top pattern that signals a trend change has formed. It is possible that after formation of the third peak
Open chart in a new window


Your IP address shows that you are currently located in the USA. If you are a resident of the United States, you are prohibited from using the services of InstaFintech Group including online trading, online transfers, deposit/withdrawal of funds, etc.
If you think you are seeing this message by mistake and your location is not the US, kindly proceed to the website. Otherwise, you must leave the website in order to comply with government restrictions.
Why does your IP address show your location as the USA?
Please confirm whether you are a US resident or not by clicking the relevant button below. If you choose the wrong option, being a US resident, you will not be able to open an account with InstaTrade anyway.
We are sorry for any inconvenience caused by this message.