Patrones actuales

Los patrones son modelos gráficos que se forman en el gráfico mediante el precio. Según uno de los postulados del análisis técnico, la historia (movimiento del precio) se repite. Esto quiere decir que los movimientos del precio a menudo son similares en las mismas situaciones que hacen posible pronosticar el futuro desarrollo de la situación con una alta probabilidad.
Los patrones relevantes de InstaTrade son un servicio fácil de utilizar que permiten que conozca los últimos cambios en el mercado y reaccione a las pistas del mercado a tiempo. En nuestro servicio, siempre encontrará los últimos y más importantes patrones en cualquier par y en cualquier marco de tiempo.
Bearish pennant
was formed on 31.03 at 18:00:53 (UTC+0)
signal strength 3 of 5
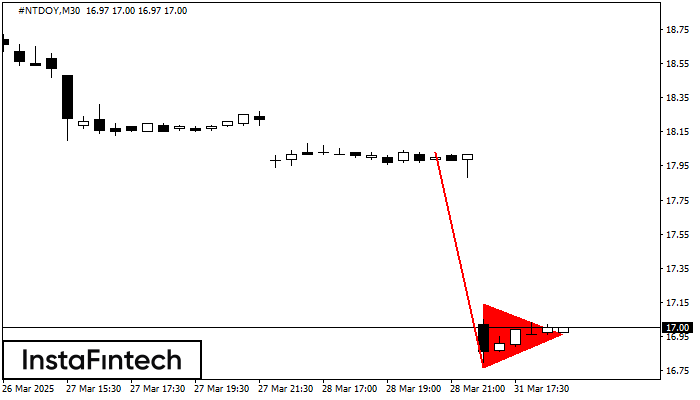
The Bearish pennant pattern has formed on the #NTDOY M30 chart. This pattern type is characterized by a slight slowdown after which the price will move in the direction of the original trend. In case the price fixes below the pattern’s low of 16.77, a trader will be able to successfully enter the sell position.
Vea asimismo
- All
- All
- Bearish Rectangle
- Bearish Symmetrical Triangle
- Bearish Symmetrical Triangle
- Bullish Rectangle
- Double Top
- Double Top
- Triple Bottom
- Triple Bottom
- Triple Top
- Triple Top
- All
- All
- Buy
- Sale
- All
- 1
- 2
- 3
- 4
- 5
Double Top
was formed on 21.04 at 11:20:02 (UTC+0)
signal strength 1 of 5
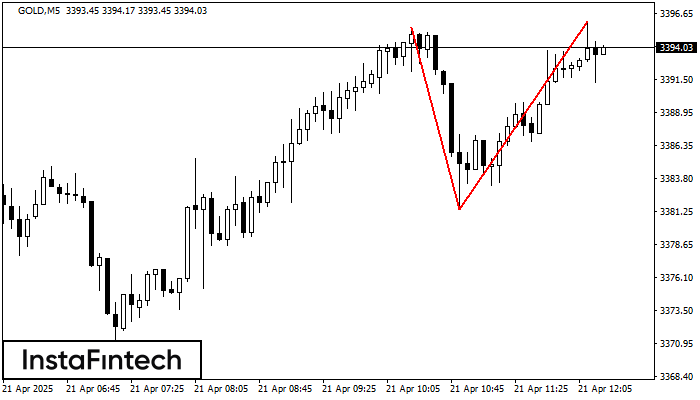
The Double Top reversal pattern has been formed on GOLD M5. Characteristics: the upper boundary 3395.58; the lower boundary 3381.38; the width of the pattern is 1463 points. Sell trades
The M5 and M15 time frames may have more false entry points.
Open chart in a new window
Double Bottom
was formed on 21.04 at 10:30:12 (UTC+0)
signal strength 2 of 5

The Double Bottom pattern has been formed on USDCAD M15; the upper boundary is 1.3801; the lower boundary is 1.3791. The width of the pattern is 11 points. In case
The M5 and M15 time frames may have more false entry points.
Open chart in a new window
Bullish pennant
was formed on 21.04 at 10:10:25 (UTC+0)
signal strength 1 of 5

The Bullish pennant signal – Trading instrument NZDCAD M5, continuation pattern. Forecast: it is possible to set up a buy position above the pattern’s high of 0.8304, with the prospect
The M5 and M15 time frames may have more false entry points.
Open chart in a new window