Patrones actuales

Los patrones son modelos gráficos que se forman en el gráfico mediante el precio. Según uno de los postulados del análisis técnico, la historia (movimiento del precio) se repite. Esto quiere decir que los movimientos del precio a menudo son similares en las mismas situaciones que hacen posible pronosticar el futuro desarrollo de la situación con una alta probabilidad.
Los patrones relevantes de InstaTrade son un servicio fácil de utilizar que permiten que conozca los últimos cambios en el mercado y reaccione a las pistas del mercado a tiempo. En nuestro servicio, siempre encontrará los últimos y más importantes patrones en cualquier par y en cualquier marco de tiempo.
Bullish Flag
was formed on 28.03 at 01:00:48 (UTC+0)
signal strength 3 of 5
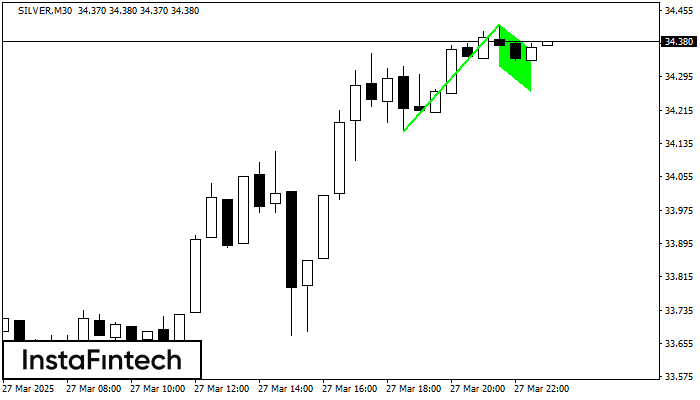
The Bullish Flag pattern has been formed on SILVER at M30. The lower boundary of the pattern is located at 34.32/34.26, while the higher boundary lies at 34.42/34.36. The projection of the flagpole is 255 points. This formation signals that the upward trend is most likely to continue. Therefore, if the level of 34.42 is broken, the price will move further upwards.
- All
- All
- Bearish Rectangle
- Bearish Symmetrical Triangle
- Bearish Symmetrical Triangle
- Bullish Rectangle
- Double Top
- Double Top
- Triple Bottom
- Triple Bottom
- Triple Top
- Triple Top
- All
- All
- Buy
- Sale
- All
- 1
- 2
- 3
- 4
- 5
Triángulo Simétrico Bajista
was formed on 21.04 at 13:29:27 (UTC+0)
signal strength 1 of 5

Según el gráfico de M5, el AUDCHF formó el patrón Triángulo Simétrico Bajista. Descripción: El límite inferior es 0.5164/0.5181 y el límite superior es 0.5203/0.5181. El ancho del patrón
Los marcos de tiempo M5 y M15 pueden tener más puntos de entrada falsos.
Open chart in a new window
Triple Techo
was formed on 21.04 at 12:40:05 (UTC+0)
signal strength 1 of 5

En el gráfico del instrumento de negociación GOLD M5, se ha formado el patrón Triple Techo que señala un cambio en la tendencia. Es posible que después de la formación
Los marcos de tiempo M5 y M15 pueden tener más puntos de entrada falsos.
Open chart in a new window
Triángulo Simétrico Bajista
was formed on 21.04 at 12:20:58 (UTC+0)
signal strength 1 of 5

Según el gráfico de M5, el GBPCHF formó el patrón Triángulo Simétrico Bajista. Recomendaciones de negociación: es posible que una ruptura del límite inferior 1.0783 fomente una continuación
Los marcos de tiempo M5 y M15 pueden tener más puntos de entrada falsos.
Open chart in a new window