Actual patterns

Patterns are graphical models which are formed in the chart by the price. According to one of the technical analysis postulates, history (price movement) repeats itself. It means that the price movements are often similar in the same situations which makes it possible to predict the further development of the situation with a high probability.
Relevant patterns by InstaTrade is an easy-to-use service which allows you to be aware of latest changes in the market and react to clues from the market in time. In our service you will always find the latest and most relevant patterns on any pair and any timeframe.
Bullish Symmetrical Triangle
was formed on 31.03 at 13:59:41 (UTC+0)
signal strength 1 of 5
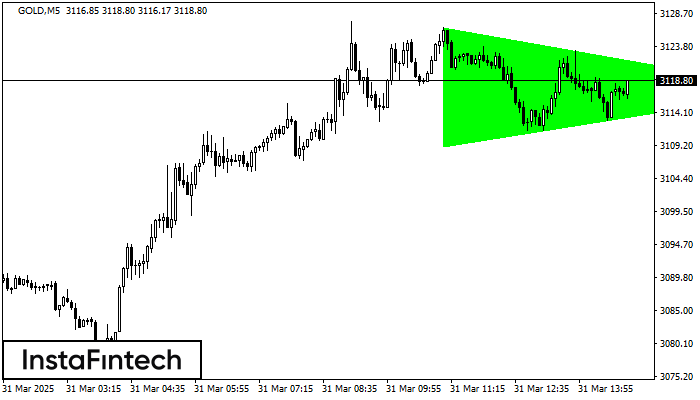
According to the chart of M5, GOLD formed the Bullish Symmetrical Triangle pattern. The lower border of the pattern touches the coordinates 3109.07/3117.44 whereas the upper border goes across 3126.71/3117.44. If the Bullish Symmetrical Triangle pattern is in progress, this evidently signals a further upward trend. In other words, in case the scenario comes true, the price of GOLD will breach the upper border to head for 3117.59.
The M5 and M15 time frames may have more false entry points.
- All
- All
- Bearish Rectangle
- Bearish Symmetrical Triangle
- Bearish Symmetrical Triangle
- Bullish Rectangle
- Double Top
- Double Top
- Triple Bottom
- Triple Bottom
- Triple Top
- Triple Top
- All
- All
- Buy
- Sale
- All
- 1
- 2
- 3
- 4
- 5
Fundo duplo
was formed on 16.04 at 22:45:07 (UTC+0)
signal strength 1 of 5
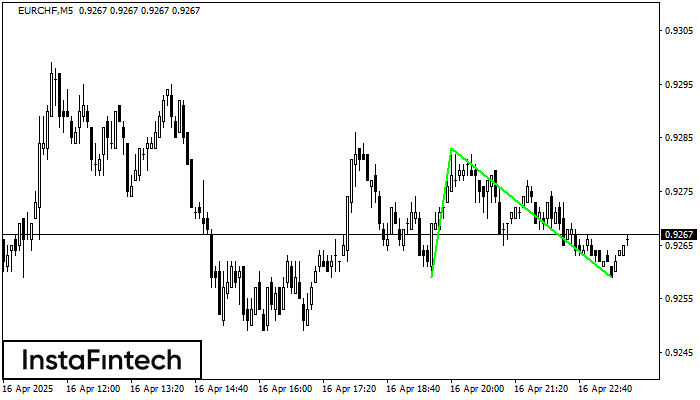
O padrão Fundo duplo foi formado em EURCHF M5; o limite superior é 0.9283; o limite inferior é 0.9259. A largura do padrão é de 24 pontos. No caso
Os intervalos M5 e M15 podem ter mais pontos de entrada falsos.
Open chart in a new window
Topo duplo
was formed on 16.04 at 20:30:32 (UTC+0)
signal strength 4 of 5

No gráfico de #KO H1 o padrão de reversão Topo duplo foi formado. Características: o limite superior 72.67; o limite inferior 71.72; a largura do padrão 95 pontos. O sinal
Open chart in a new window
Topo triplo
was formed on 16.04 at 20:30:06 (UTC+0)
signal strength 4 of 5

No gráfico do instrumento de negociação #MA H1, o padrão Topo triplo que sinaliza uma mudança de tendência se formou. É possível que após a formação do terceiro pico
Open chart in a new window