Veja também


Retângulo - um dos métodos mais famosos e simples de análise técnica na negociação. Embora seja fácil de determinar nos gráficos, esta é uma figura importante e muito forte, que é um indicador da continuação da tendência. Devido ao reconhecimento correto do retângulo, o trader pode entrar com sucesso no mercado.
The Rectangle is one of the most popular and easy patterns that is used in the technical analysis. Though being a rather simple pattern, it is a quite important and strong figure that is a very obvious sign of a trend continuation. After noticing it, a trader gets an opportunity to place a potentially profitable order.
In other words, the Rectangle signals a sort of a pause in a trend, indicating price consolidation before a jump towards the unfolding trend. This pattern is formed when the market is trading sideways.
The pattern looks similar to another figure of the technical analysis – the Flag. However, the Rectangle has horizontal support and resistance lines, and there is no flagpole in it. Prices move inside the pattern between two parallel lines. Two vertical lines can be drawn in order to complete the figure, but it is not necessary as they do not play any significant role.
It is important to pay attention to the fundamental components. Formation of the Rectangle often precedes publication of some important news the result of which is hard to be predicted. If the published data coincides with forecasts, then prices usually move with the previous bias.
It often happens that prices break in the direction of the previous trend. That is why the Rectangle is defined as a continuation pattern. However, sometimes prices break the pattern and move in the opposite direction. In that case the Rectangle becomes a reversal pattern. It may happen after macroeconomic statistics do not match forecasts.
It is quite easy to distinguish the Rectangle on a chart. It looks as a small trading channel or a sideways trend. The figure indicates that bears and bulls reached parity. Until a support or resistance line is broken, the Rectangle signals continuation of a trend.
If the Rectangle appears in the bullish market, then prices break upwards and such a figure is called the Bullish rectangle. If it occurs in the bearish market and prices break downwards, then the figure is called a bearish Rectangle.
De acordo com o gráfico de M30, GOLD formou o Retângulo de alta que é um padrão de uma continuação da tendência. O padrão está dentro dos seguintes limites
Open chart in a new window
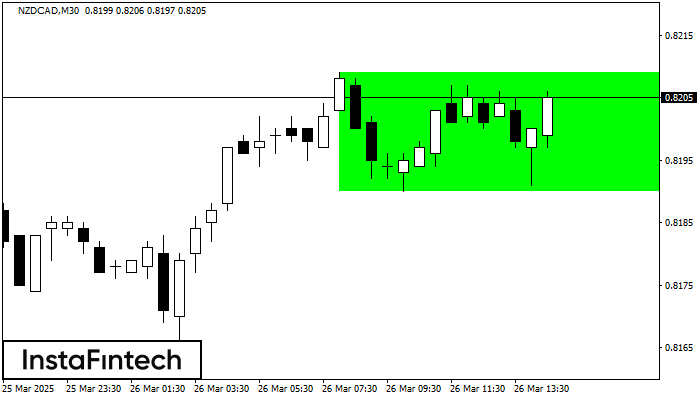
De acordo com o gráfico de M30, NZDCAD formou o Retângulo de alta que é um padrão de uma continuação da tendência. O padrão está dentro dos seguintes limites
Open chart in a new window
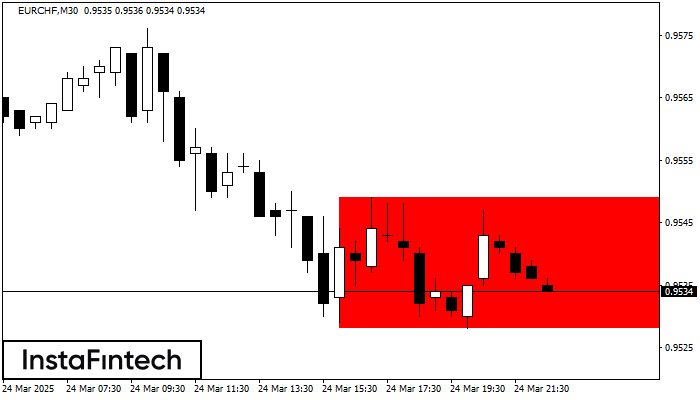
De acordo com o gráfico de M30, EURCHF formou Retângulo de baixa. Este tipo de padrão indica uma continuação da tendência. Ele consiste em dois níveis: resistência 0.9549 – 0.0000
Open chart in a new window


Your IP address shows that you are currently located in the USA. If you are a resident of the United States, you are prohibited from using the services of InstaFintech Group including online trading, online transfers, deposit/withdrawal of funds, etc.
If you think you are seeing this message by mistake and your location is not the US, kindly proceed to the website. Otherwise, you must leave the website in order to comply with government restrictions.
Why does your IP address show your location as the USA?
Please confirm whether you are a US resident or not by clicking the relevant button below. If you choose the wrong option, being a US resident, you will not be able to open an account with InstaTrade anyway.
We are sorry for any inconvenience caused by this message.