Padrões atuais

Padrões são modelos gráficos que são formados no gráfico pelo preço. Segundo um dos postulados da análise técnica, a história (movimento de preços) se repete. Isso significa que os movimentos de preços geralmente são semelhantes nas mesmas situações, o que possibilita prever o desenvolvimento futuro da situação com alta probabilidade.
Os padrões relevantes da InstaTrade são um serviço fácil de usar, que permite que você esteja ciente das últimas mudanças no mercado e reaja a indícios do mercado a tempo. Em nosso serviço, você sempre encontrará os padrões mais recentes e relevantes em qualquer par e em qualquer período gráfico.
Double Bottom
was formed on 02.04 at 00:00:26 (UTC+0)
signal strength 3 of 5
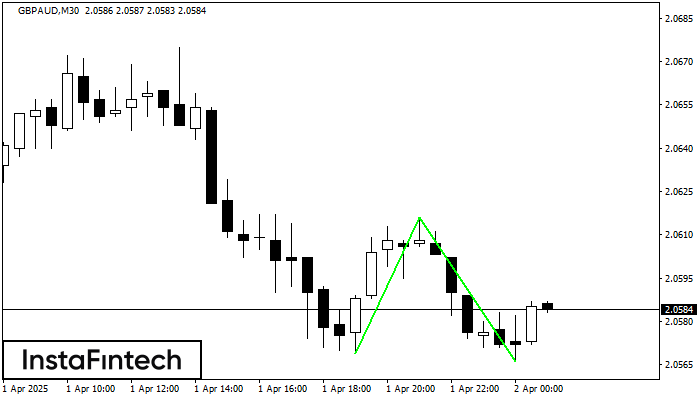
The Double Bottom pattern has been formed on GBPAUD M30; the upper boundary is 2.0616; the lower boundary is 2.0566. The width of the pattern is 47 points. In case of a break of the upper boundary 2.0616, a change in the trend can be predicted where the width of the pattern will coincide with the distance to a possible take profit level.
- All
- All
- Bearish Rectangle
- Bearish Symmetrical Triangle
- Bearish Symmetrical Triangle
- Bullish Rectangle
- Double Top
- Double Top
- Triple Bottom
- Triple Bottom
- Triple Top
- Triple Top
- All
- All
- Buy
- Sale
- All
- 1
- 2
- 3
- 4
- 5
Fundo triplo
was formed on 14.04 at 01:00:54 (UTC+0)
signal strength 4 of 5

O padrão Fundo triplo foi formado em USDCHF H1. Possui as seguintes características: nível de resistência 0.8256/0.8192; nível de suporte 0.8140/0.8142; a largura é de 116 pontos. Se houver
Open chart in a new window
Topo duplo
was formed on 14.04 at 00:45:17 (UTC+0)
signal strength 2 of 5

O padrão Topo duplo foi formado em AUDCAD M15. Isso sinaliza que a tendência foi alterada de cima para baixo. Provavelmente, se a base do padrão 0.8713 for quebrada
Os intervalos M5 e M15 podem ter mais pontos de entrada falsos.
Open chart in a new window
Retângulo de alta
was formed on 14.04 at 00:42:49 (UTC+0)
signal strength 1 of 5
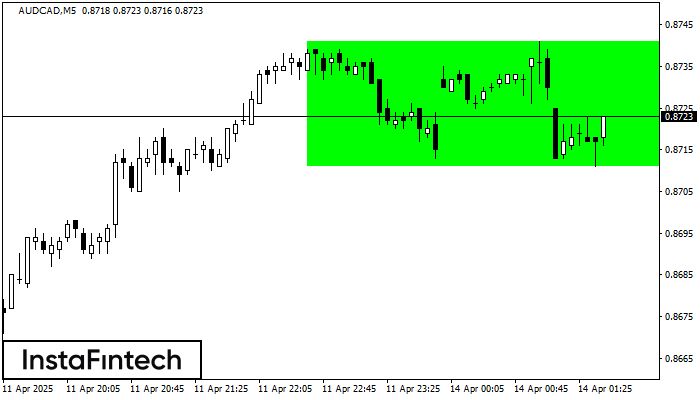
De acordo com o gráfico de M5, AUDCAD formou o Retângulo de alta que é um padrão de uma continuação da tendência. O padrão está dentro dos seguintes limites
Os intervalos M5 e M15 podem ter mais pontos de entrada falsos.
Open chart in a new window