Padrões atuais

Padrões são modelos gráficos que são formados no gráfico pelo preço. Segundo um dos postulados da análise técnica, a história (movimento de preços) se repete. Isso significa que os movimentos de preços geralmente são semelhantes nas mesmas situações, o que possibilita prever o desenvolvimento futuro da situação com alta probabilidade.
Os padrões relevantes da InstaTrade são um serviço fácil de usar, que permite que você esteja ciente das últimas mudanças no mercado e reaja a indícios do mercado a tempo. Em nosso serviço, você sempre encontrará os padrões mais recentes e relevantes em qualquer par e em qualquer período gráfico.
Bullish Symmetrical Triangle
was formed on 21.03 at 22:40:31 (UTC+0)
signal strength 1 of 5

According to the chart of M5, AUDUSD formed the Bullish Symmetrical Triangle pattern. Description: This is the pattern of a trend continuation. 0.6279 and 0.6267 are the coordinates of the upper and lower borders respectively. The pattern width is measured on the chart at 12 pips. Outlook: If the upper border 0.6279 is broken, the price is likely to continue its move by 0.6288.
The M5 and M15 time frames may have more false entry points.
Veja também
- All
- All
- Bearish Rectangle
- Bearish Symmetrical Triangle
- Bearish Symmetrical Triangle
- Bullish Rectangle
- Double Top
- Double Top
- Triple Bottom
- Triple Bottom
- Triple Top
- Triple Top
- All
- All
- Buy
- Sale
- All
- 1
- 2
- 3
- 4
- 5
Pennant de alta
was formed on 28.03 at 01:55:41 (UTC+0)
signal strength 1 of 5
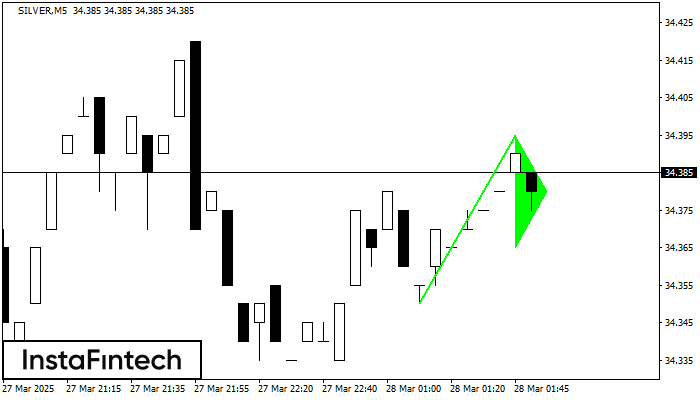
O padrão Pennant de alta é formado no gráfico SILVER M5. Ele é um tipo do padrão de continuação. Supostamente, se o preço for fixado acima da alta de 34.40
Os intervalos M5 e M15 podem ter mais pontos de entrada falsos.
Open chart in a new window
Fundo triplo
was formed on 28.03 at 01:45:48 (UTC+0)
signal strength 2 of 5
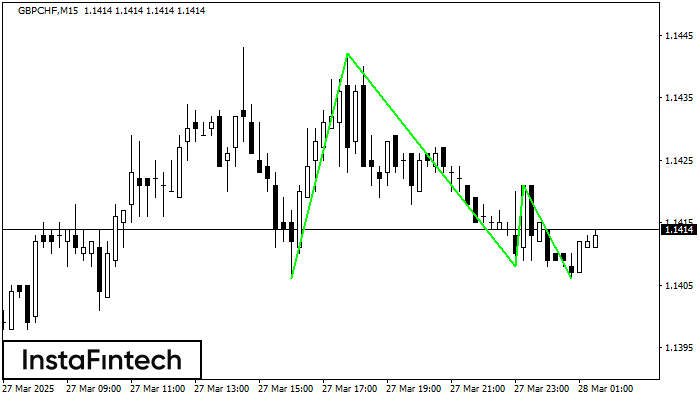
O padrão Fundo triplo foi formado no gráfico de GBPCHF M15. Características do padrão: A linha inferior do padrão tem coordenadas 1.1442 com o limite superior 1.1442/1.1421, a projeção
Os intervalos M5 e M15 podem ter mais pontos de entrada falsos.
Open chart in a new window
Topo triplo
was formed on 28.03 at 01:30:25 (UTC+0)
signal strength 3 of 5
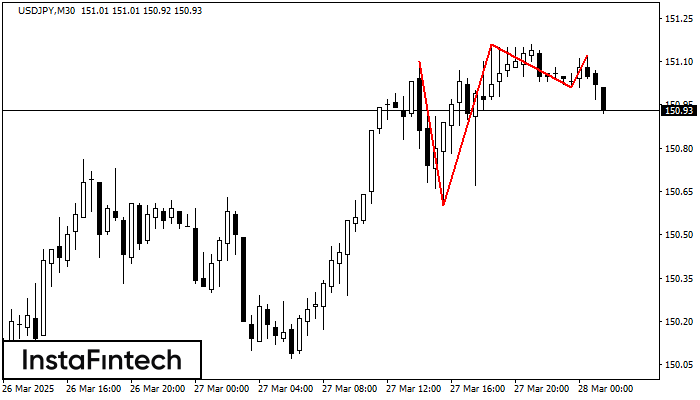
O padrão Topo triplo foi formado no gráfico do instrumento de negociação USDJPY M30. É um padrão de reversão com as seguintes características: nível de resistência -2, nível de suporte
Open chart in a new window