Padrões atuais

Padrões são modelos gráficos que são formados no gráfico pelo preço. Segundo um dos postulados da análise técnica, a história (movimento de preços) se repete. Isso significa que os movimentos de preços geralmente são semelhantes nas mesmas situações, o que possibilita prever o desenvolvimento futuro da situação com alta probabilidade.
Os padrões relevantes da InstaTrade são um serviço fácil de usar, que permite que você esteja ciente das últimas mudanças no mercado e reaja a indícios do mercado a tempo. Em nosso serviço, você sempre encontrará os padrões mais recentes e relevantes em qualquer par e em qualquer período gráfico.
Bearish Rectangle
was formed on 21.03 at 15:03:03 (UTC+0)
signal strength 3 of 5
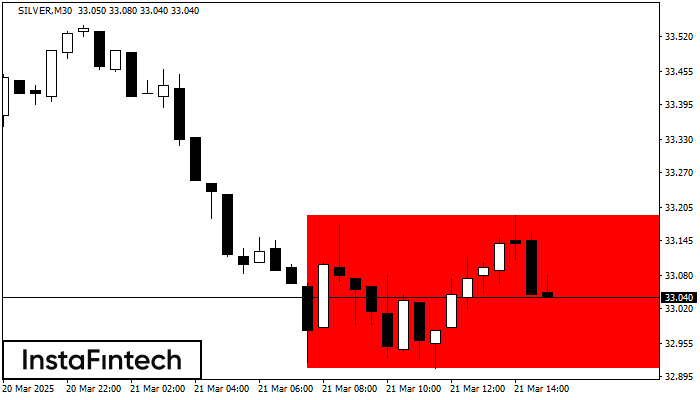
According to the chart of M30, SILVER formed the Bearish Rectangle. The pattern indicates a trend continuation. The upper border is 33.19, the lower border is 32.91. The signal means that a short position should be opened after fixing a price below the lower border 32.91 of the Bearish Rectangle.
Veja também
- All
- All
- Bearish Rectangle
- Bearish Symmetrical Triangle
- Bearish Symmetrical Triangle
- Bullish Rectangle
- Double Top
- Double Top
- Triple Bottom
- Triple Bottom
- Triple Top
- Triple Top
- All
- All
- Buy
- Sale
- All
- 1
- 2
- 3
- 4
- 5
Double Bottom
сформирован 28.03 в 09:30:34 (UTC+0)
сила сигнала 3 из 5
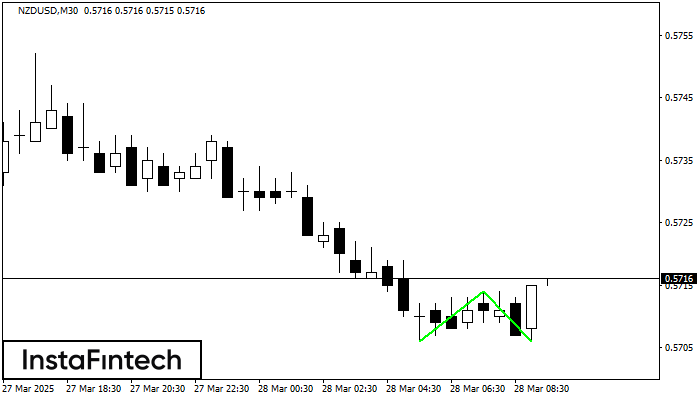
The Double Bottom pattern has been formed on NZDUSD M30. This formation signals a reversal of the trend from downwards to upwards. The signal is that a buy trade should
Открыть график инструмента в новом окне
Double Bottom
сформирован 28.03 в 09:30:15 (UTC+0)
сила сигнала 2 из 5
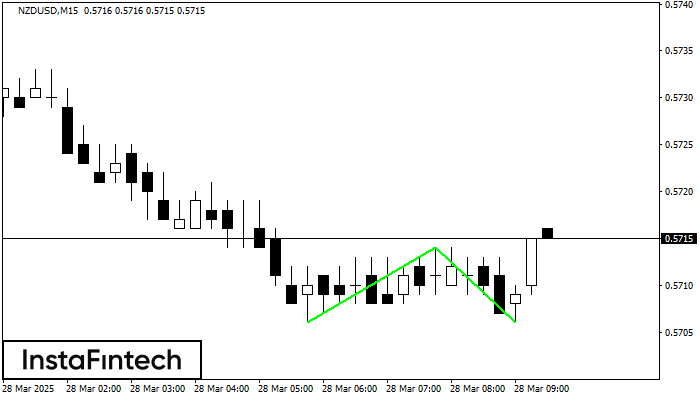
The Double Bottom pattern has been formed on NZDUSD M15. This formation signals a reversal of the trend from downwards to upwards. The signal is that a buy trade should
The M5 and M15 time frames may have more false entry points.
Открыть график инструмента в новом окне
Double Bottom
сформирован 28.03 в 09:21:05 (UTC+0)
сила сигнала 1 из 5
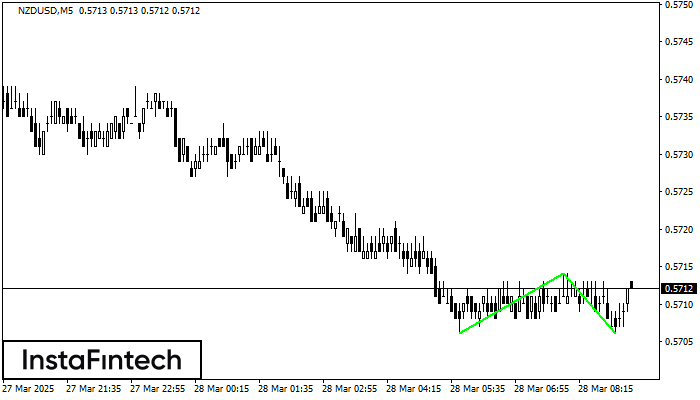
The Double Bottom pattern has been formed on NZDUSD M5. Characteristics: the support level 0.5706; the resistance level 0.5714; the width of the pattern 8 points. If the resistance level
The M5 and M15 time frames may have more false entry points.
Открыть график инструмента в новом окне