یہ بھی دیکھیں

 23.01.2025 01:08 PM
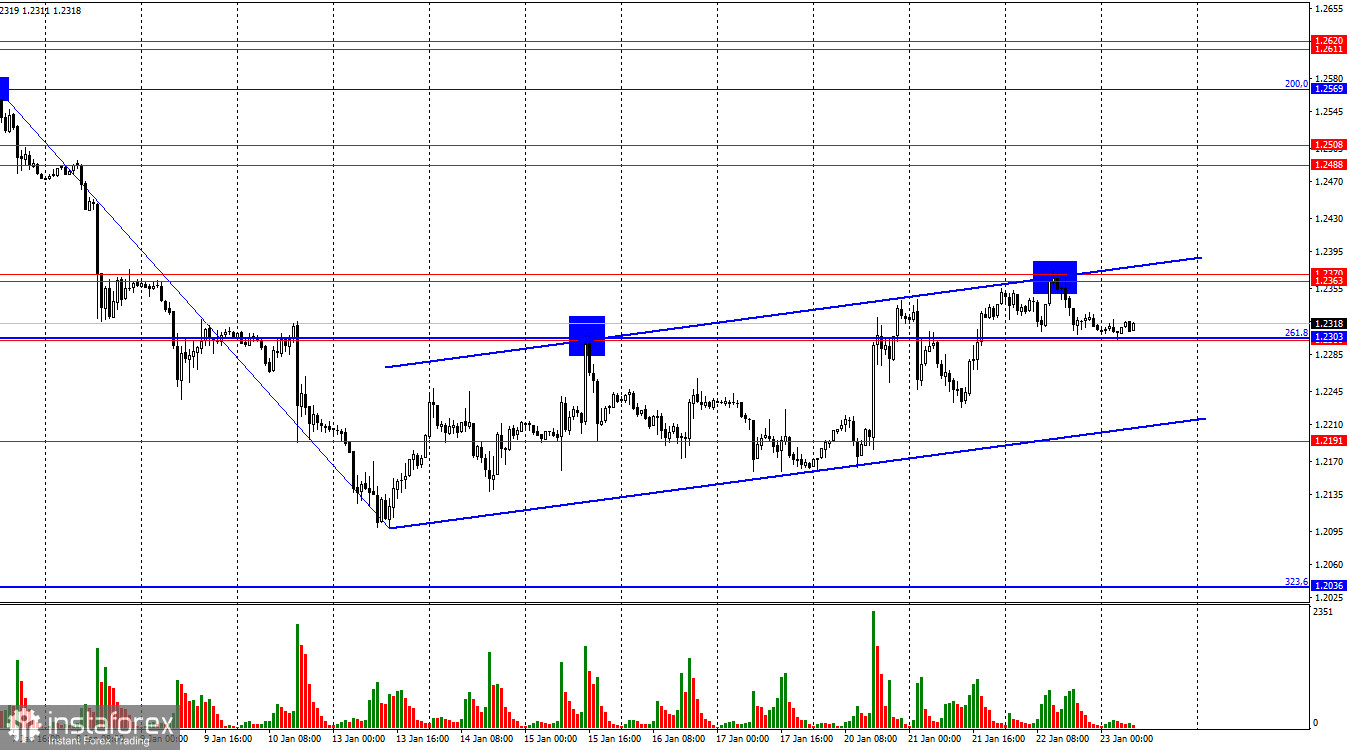
On the hourly chart, the GBP/USD pair rose to the resistance zone of 1.2363–1.2370 on Wednesday, rebounded from it, and reversed in favor of the US dollar. As of Thursday morning, the pair has declined to the 261.8% Fibonacci corrective level at 1.2303. A consolidation below this level could lead to further declines toward the lower boundary of the upward trend channel. A rebound, however, could signal a resumption of growth above the 1.2363–1.2370 zone.
The situation with waves is quite clear. The last completed downward wave broke the low of the previous wave, while the most recent upward wave has yet to approach the last peak. Therefore, the formation of a bearish trend continues without doubt. To end this trend, the pound must rise to at least 1.2569 and close confidently above this level. Such a development is unlikely in the near term.
On Wednesday, both the UK and US lacked significant economic news, leaving the market to speculate on President Donald Trump's initial actions on the international stage. Concerns about potential tariffs on the EU, Canada, Mexico, and China have already been priced in by traders. Now, the market awaits concrete actions from the White House before reacting again. Until the end of this week, trading activity may remain low due to weak news flow. Tomorrow, however, business activity reports from the European region could provide some market movement, but only if the data impress or surprise traders significantly.
Overall, the British and European economies remain weak, and I do not expect business activity indices to exceed traders' expectations significantly. However, I also do not anticipate a significant drop in the pound by the end of this week. Bulls are currently very weak but continue to make small and infrequent attempts at a rally.
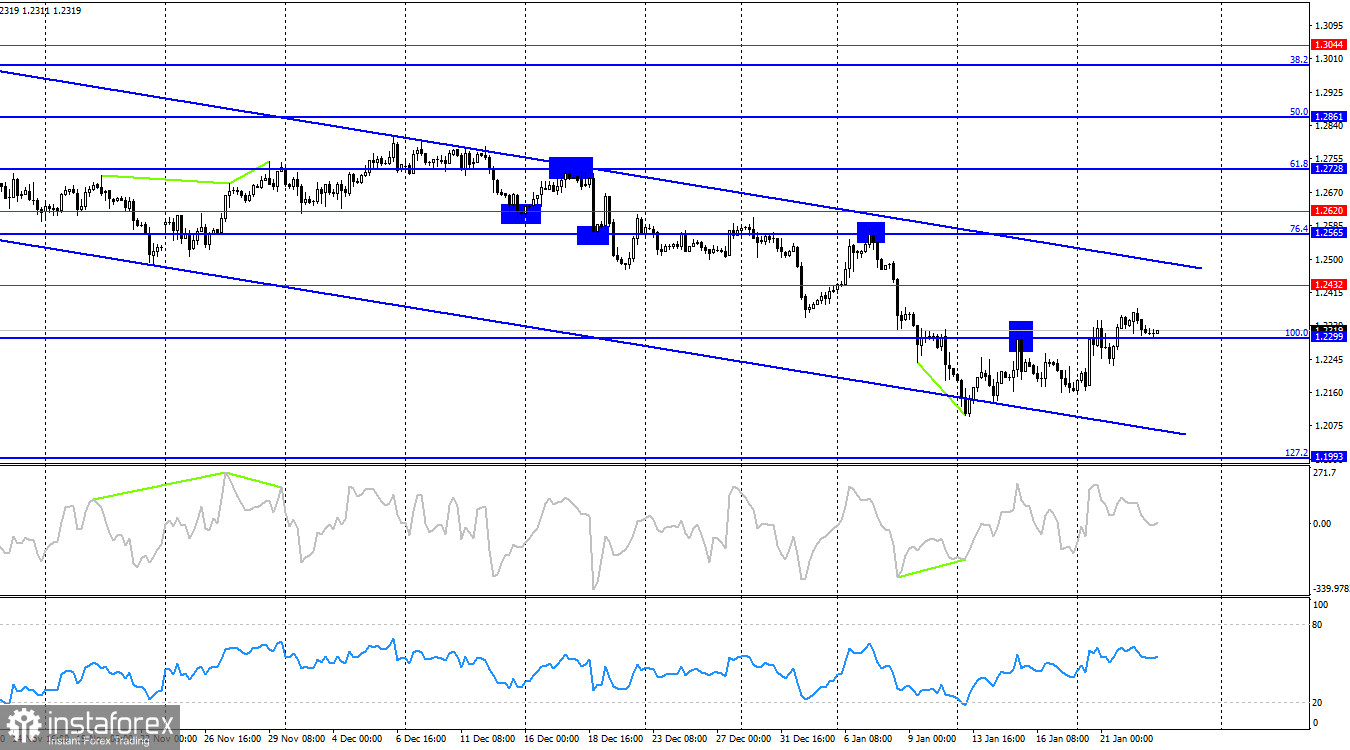
On the 4-hour chart, the pair may continue to grow within a downward trend channel, but the hourly chart suggests a higher likelihood of bears gaining the upper hand in the near future. I recommend paying closer attention to the hourly chart for now. No emerging divergences are observed in any indicators today.
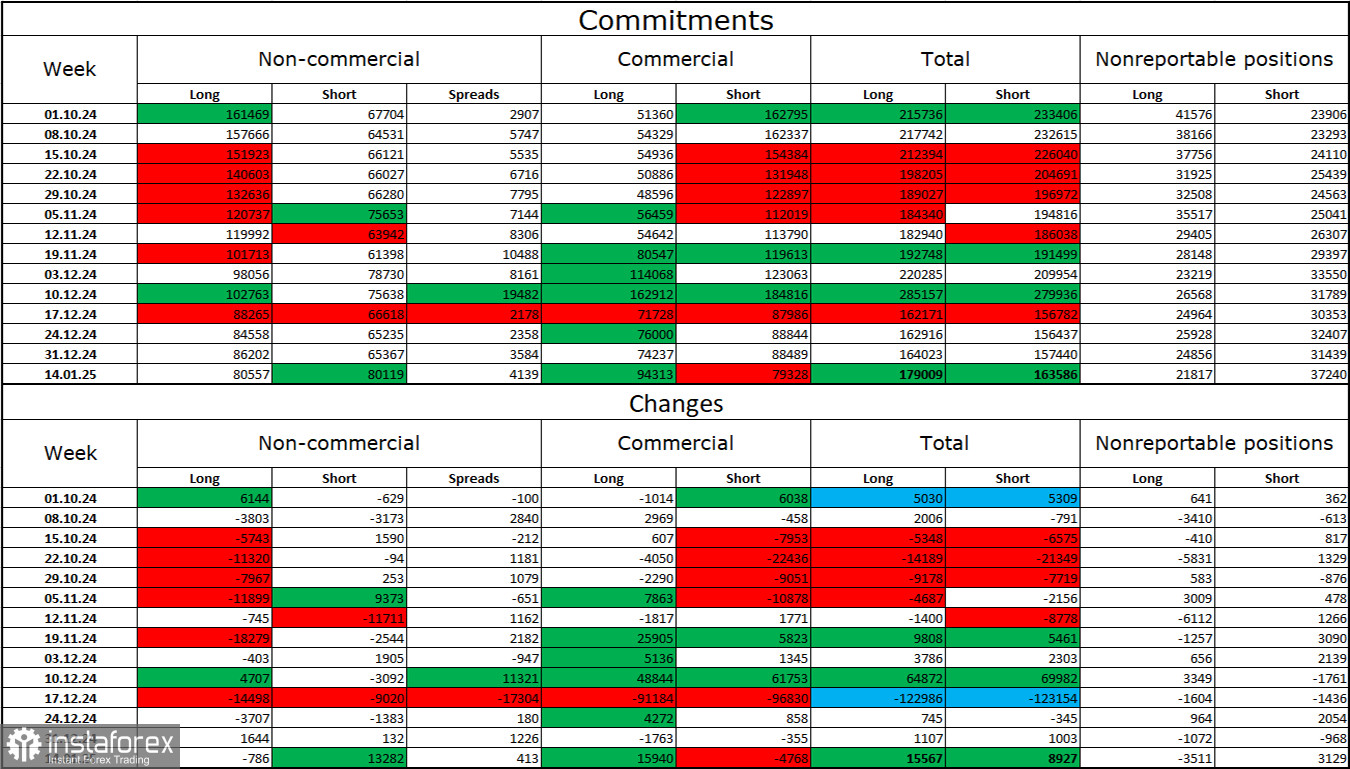
The sentiment among Non-commercial traders became noticeably more bearish during the last reporting week. The number of long positions held by speculators decreased by 786, while short positions increased by 13,282. Bulls have lost all market advantages, a process that has been ongoing for several months. The gap between long and short positions has now disappeared: 80,000 vs. 80,000.
In my view, the pound continues to face downward risks, with the COT reports consistently signaling a strengthening of bearish positions almost every week. Over the past three months, the number of long positions has fallen from 161,000 to 80,000, while short positions have risen from 67,000 to 80,000. I believe professional players will continue to offload long positions or build up shorts over time, as all potential bullish factors for the British pound have already been priced in. Graphical analysis also supports further declines in the pound.
On Thursday, the economic calendar features only one relatively minor report. The impact of this news on trader sentiment throughout the day will likely be minimal or nonexistent.
Sales of the pair were possible after a rebound on the hourly chart from the 1.2363–1.2370 zone, with targets at 1.2191 and 1.2036. Today, a consolidation below the 1.2303 level would justify holding onto short positions. I still do not recommend considering long positions.
Fibonacci levels are constructed from 1.3000–1.3432 on the hourly chart and from 1.2299–1.3432 on the 4-hour chart.


