Долзарб паттернлар

Двойная вершина
сформирован 04.04 в 21:55:03 (UTC+0)
сила сигнала 1 из 5
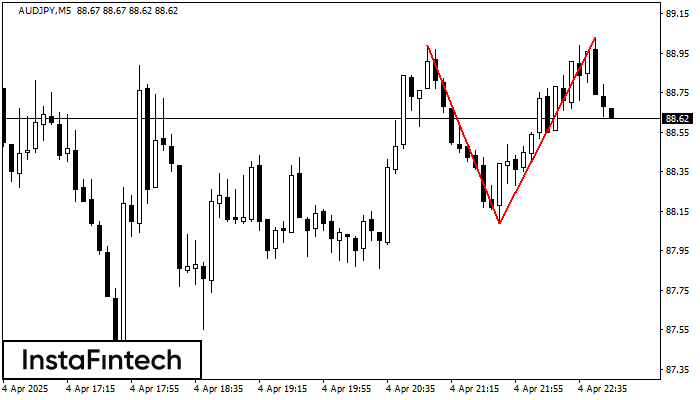
По торговому инструменту AUDJPY на M5 сформировалась фигура «Двойная вершина», которая сигнализирует нам об изменении тенденции с восходящей на нисходящую. Вероятно, что, в случае пробоя основания фигуры 88.09, возможно дальнейшее нисходящее движение.
Таймфреймы М5 и М15 могут иметь больше ложных точек входа.
Шунингдек кўринг
- Все
- Все
- Bearish Rectangle
- Bearish Symmetrical Triangle
- Bearish Symmetrical Triangle
- Bullish Rectangle
- Double Top
- Double Top
- Triple Bottom
- Triple Bottom
- Triple Top
- Triple Top
- Все
- Все
- Покупка
- Продажа
- Все
- 1
- 2
- 3
- 4
- 5
Bearish Rectangle
was formed on 10.04 at 20:15:38 (UTC+0)
signal strength 1 of 5
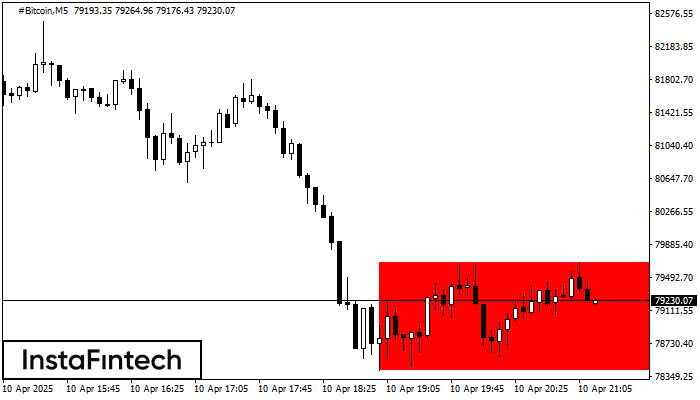
According to the chart of M5, #Bitcoin formed the Bearish Rectangle. The pattern indicates a trend continuation. The upper border is 79670.12, the lower border is 78416.24. The signal means
The M5 and M15 time frames may have more false entry points.
Open chart in a new window
Bearish Symmetrical Triangle
was formed on 10.04 at 20:14:25 (UTC+0)
signal strength 1 of 5
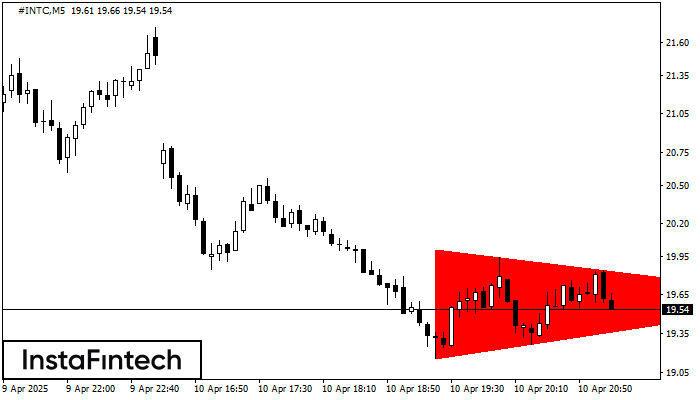
According to the chart of M5, #INTC formed the Bearish Symmetrical Triangle pattern. Trading recommendations: A breach of the lower border 19.16 is likely to encourage a continuation
The M5 and M15 time frames may have more false entry points.
Open chart in a new window
Bearish Symmetrical Triangle
was formed on 10.04 at 20:02:22 (UTC+0)
signal strength 3 of 5
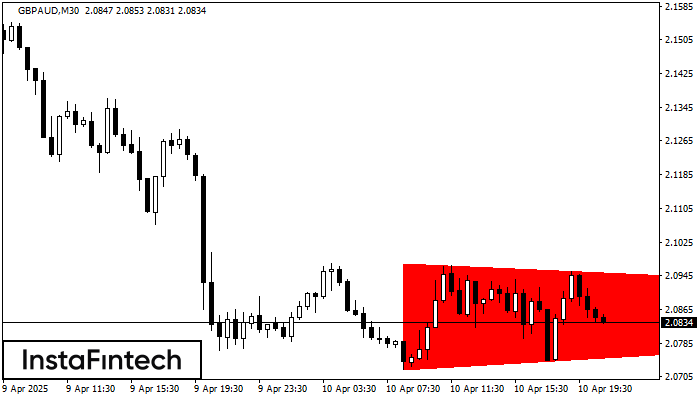
According to the chart of M30, GBPAUD formed the Bearish Symmetrical Triangle pattern. Description: The lower border is 2.0723/2.0864 and upper border is 2.0974/2.0864. The pattern width is measured
Open chart in a new window