Долзарб паттернлар

Двойная вершина
сформирован 03.04 в 05:15:06 (UTC+0)
сила сигнала 1 из 5
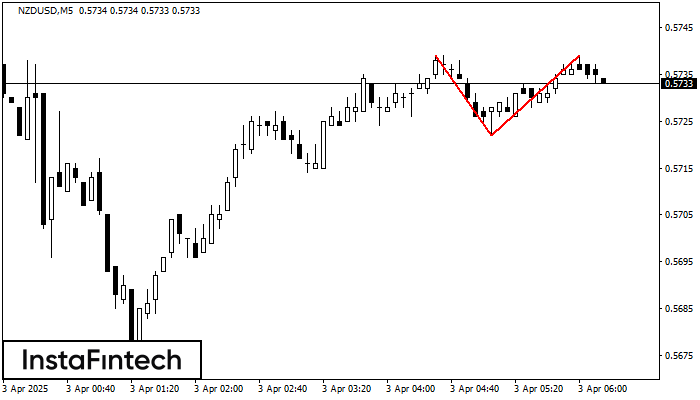
По NZDUSD на M5 сформировалась разворотная фигура «Двойная вершина». Характеристика: Верхняя граница 0.5739; Нижняя граница 0.5722; Ширина фигуры 17 пунктов. Позицию на продажу возможно открыть ниже нижней границы 0.5722, с перспективой хода к уровню 0.5707.
Таймфреймы М5 и М15 могут иметь больше ложных точек входа.
Шунингдек кўринг
- Все
- Все
- Bearish Rectangle
- Bearish Symmetrical Triangle
- Bearish Symmetrical Triangle
- Bullish Rectangle
- Double Top
- Double Top
- Triple Bottom
- Triple Bottom
- Triple Top
- Triple Top
- Все
- Все
- Покупка
- Продажа
- Все
- 1
- 2
- 3
- 4
- 5
Bearish Rectangle
was formed on 17.04 at 01:35:04 (UTC+0)
signal strength 2 of 5
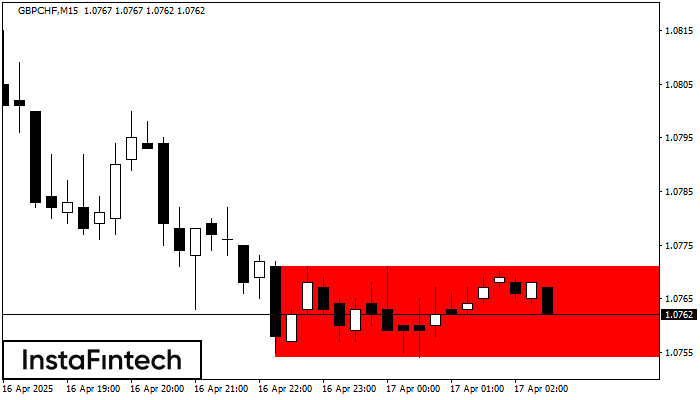
According to the chart of M15, GBPCHF formed the Bearish Rectangle. The pattern indicates a trend continuation. The upper border is 1.0771, the lower border is 1.0754. The signal means
The M5 and M15 time frames may have more false entry points.
Open chart in a new window
Bearish Rectangle
was formed on 17.04 at 01:12:52 (UTC+0)
signal strength 1 of 5
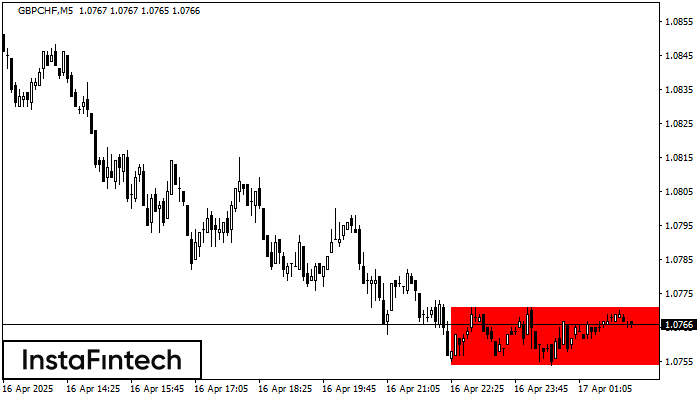
According to the chart of M5, GBPCHF formed the Bearish Rectangle. The pattern indicates a trend continuation. The upper border is 1.0771, the lower border is 1.0754. The signal means
The M5 and M15 time frames may have more false entry points.
Open chart in a new window
Bearish Rectangle
was formed on 17.04 at 01:06:37 (UTC+0)
signal strength 1 of 5
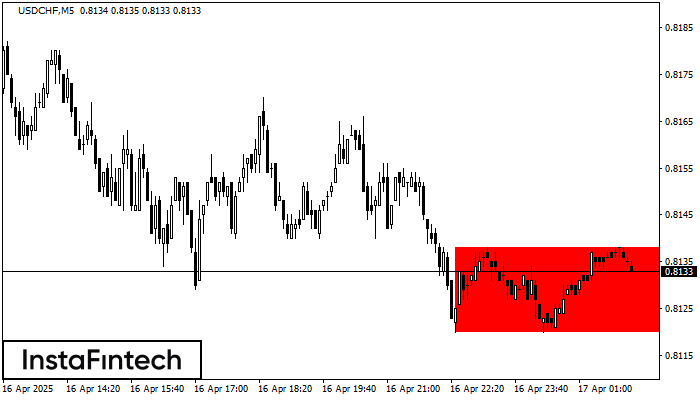
According to the chart of M5, USDCHF formed the Bearish Rectangle. The pattern indicates a trend continuation. The upper border is 0.8138, the lower border is 0.8120. The signal means
The M5 and M15 time frames may have more false entry points.
Open chart in a new window