Долзарб паттернлар

Двойная вершина
сформирован 31.03 в 15:00:07 (UTC+0)
сила сигнала 4 из 5
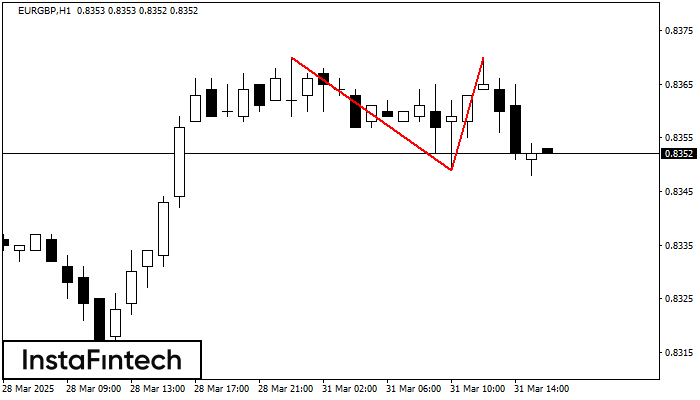
На торговом графике EURGBP H1 сформировалась разворотная фигура «Двойная вершина». Характеристика: Верхняя граница 0.8370; Нижняя граница 0.8349; Ширина фигуры 21 пунктов. Сигнал: Пробой нижней границы 0.8349 приведет к дальнейшему нисходящему движению с перспективой хода к уровню 0.8309.
Шунингдек кўринг
- Все
- Все
- Bearish Rectangle
- Bearish Symmetrical Triangle
- Bearish Symmetrical Triangle
- Bullish Rectangle
- Double Top
- Double Top
- Triple Bottom
- Triple Bottom
- Triple Top
- Triple Top
- Все
- Все
- Покупка
- Продажа
- Все
- 1
- 2
- 3
- 4
- 5
Double Bottom
was formed on 16.04 at 23:50:16 (UTC+0)
signal strength 1 of 5
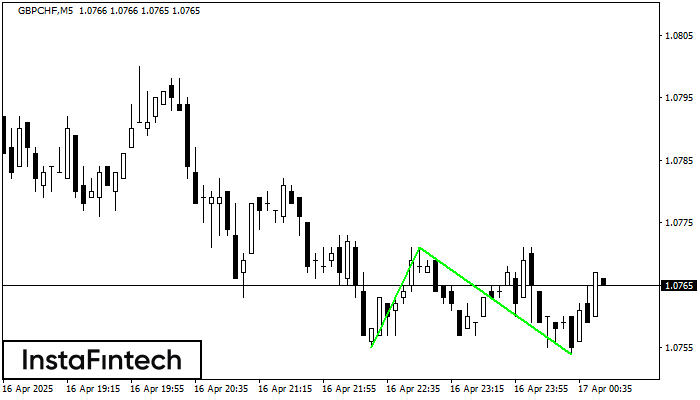
The Double Bottom pattern has been formed on GBPCHF M5. This formation signals a reversal of the trend from downwards to upwards. The signal is that a buy trade should
The M5 and M15 time frames may have more false entry points.
Open chart in a new window
Double Bottom
was formed on 16.04 at 23:26:06 (UTC+0)
signal strength 1 of 5
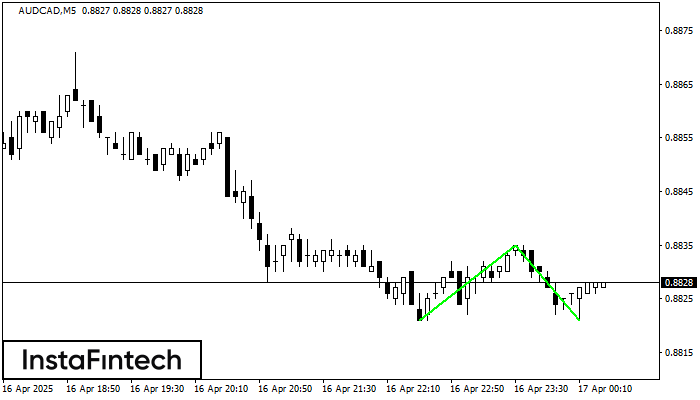
The Double Bottom pattern has been formed on AUDCAD M5; the upper boundary is 0.8835; the lower boundary is 0.8821. The width of the pattern is 14 points. In case
The M5 and M15 time frames may have more false entry points.
Open chart in a new window
Double Bottom
was formed on 16.04 at 22:45:07 (UTC+0)
signal strength 1 of 5
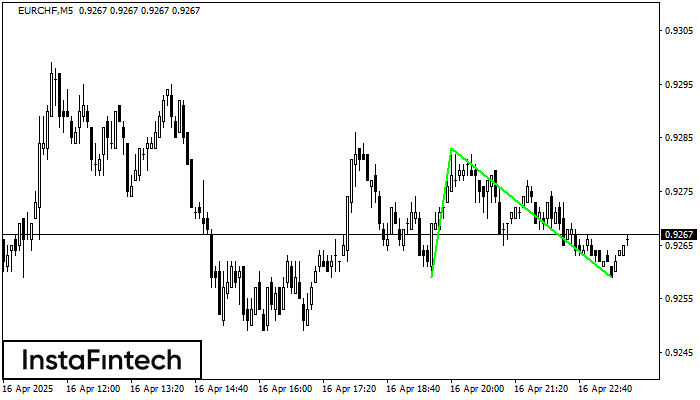
The Double Bottom pattern has been formed on EURCHF M5; the upper boundary is 0.9283; the lower boundary is 0.9259. The width of the pattern is 24 points. In case
The M5 and M15 time frames may have more false entry points.
Open chart in a new window