

Corak sebenar

Triple Bottom
was formed on 04.04 at 20:35:18 (UTC+0)
signal strength 1 of 5
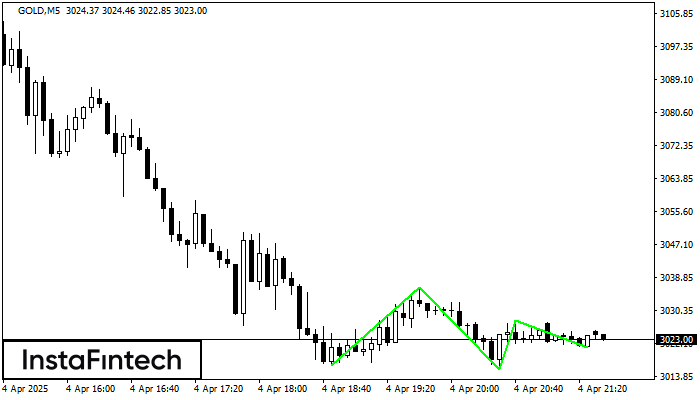
The Triple Bottom pattern has formed on the chart of GOLD M5. Features of the pattern: The lower line of the pattern has coordinates 3036.35 with the upper limit 3036.35/3028.06, the projection of the width is 1989 points. The formation of the Triple Bottom pattern most likely indicates a change in the trend from downward to upward. This means that in the event of a breakdown of the resistance level 3016.46, the price is most likely to continue the upward movement.
The M5 and M15 time frames may have more false entry points.
- All
- All
- Bearish Rectangle
- Bearish Symmetrical Triangle
- Bearish Symmetrical Triangle
- Bullish Rectangle
- Double Top
- Double Top
- Triple Bottom
- Triple Bottom
- Triple Top
- Triple Top
- All
- All
- Buy
- Sale
- All
- 1
- 2
- 3
- 4
- 5
Segi Empat Menaik
was formed on 17.04 at 03:25:23 (UTC+0)
signal strength 1 of 5

Berdasarkan carta M5, NZDCHF telah membentuk Segi Empat Menaik. Jenis corak ini menunjukkan kesinambungan aliran. Ia terdiri daripada dua tahap: rintangan 0.4833 dan sokongan 0.4824. Sekiranya tahap rintangan 0.4833
Carta masa M5 dan M15 mungkin mempunyai lebih banyak titik kemasukan palsu.
Open chart in a new window
Segi Tiga Simetri Menaik
was formed on 17.04 at 03:06:58 (UTC+0)
signal strength 2 of 5

Berdasarkan carta M15, EURNZD membentuk corak Segi Tiga Simetri Menaik. Sempadan yang lebih rendah bagi corak yang menyentuh koordinat 1.9161/1.9208 di mana sempadan atas merentasi 1.9252/1.9208. Sekiranya corak Segi Tiga
Carta masa M5 dan M15 mungkin mempunyai lebih banyak titik kemasukan palsu.
Open chart in a new window
Segi Tiga Simetri Menaik
was formed on 17.04 at 03:06:49 (UTC+0)
signal strength 3 of 5

Berdasarkan carta M30, EURNZD membentuk corak Segi Tiga Simetri Menaik. Penerangan: Ini adalah corak kesinambungan aliran. 1.9252 dan 1.9161 adalah koordinat sempadan atas dan bawah masing-masing. Lebar corak diukur pada
Open chart in a new window


