Corak sebenar

Triple Top
was formed on 03.04 at 07:15:04 (UTC+0)
signal strength 2 of 5
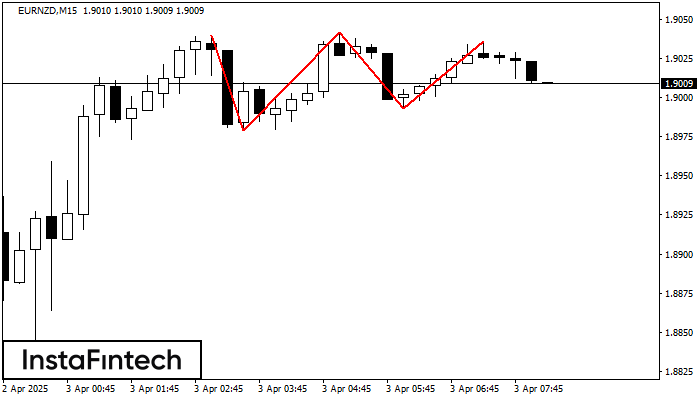
On the chart of the EURNZD M15 trading instrument, the Triple Top pattern that signals a trend change has formed. It is possible that after formation of the third peak, the price will try to break through the resistance level 1.8979, where we advise to open a trading position for sale. Take profit is the projection of the pattern’s width, which is 61 points.
The M5 and M15 time frames may have more false entry points.
Juga lihat
- All
- All
- Bearish Rectangle
- Bearish Symmetrical Triangle
- Bearish Symmetrical Triangle
- Bullish Rectangle
- Double Top
- Double Top
- Triple Bottom
- Triple Bottom
- Triple Top
- Triple Top
- All
- All
- Buy
- Sale
- All
- 1
- 2
- 3
- 4
- 5
Triple Bottom
was formed on 14.04 at 03:00:24 (UTC+0)
signal strength 2 of 5

Corak Triple Bottom telah dibentuk pada EURNZD M15. Ia mempunyai ciri-ciri berikut: tahap rintangan 1.9498/1.9463; tahap sokongan 1.9409/1.9402; lebar corak adalah 89 mata. Dalam situasi penembusan paras rintangan 1.9498, harga
Carta masa M5 dan M15 mungkin mempunyai lebih banyak titik kemasukan palsu.
Open chart in a new window
Segi Tiga Simetri Menaik
was formed on 14.04 at 02:51:59 (UTC+0)
signal strength 1 of 5

Berdasarkan carta M5, GBPAUD membentuk corak Segi Tiga Simetri Menaik. Sempadan yang lebih rendah bagi corak yang menyentuh koordinat 2.0704/2.0775 di mana sempadan atas merentasi 2.0831/2.0775. Sekiranya corak Segi Tiga
Carta masa M5 dan M15 mungkin mempunyai lebih banyak titik kemasukan palsu.
Open chart in a new window
Double Top
was formed on 14.04 at 02:30:27 (UTC+0)
signal strength 2 of 5
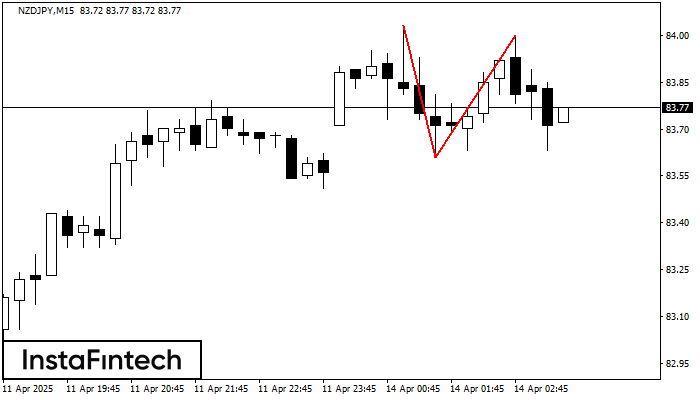
Corak pembalikan Double Top telah dibentuk pada NZDJPY M15. Ciri-ciri: sempadan atas %P0.000000; sempadan bawah 84.03; sempadan bawah 83.61; lebar corak adalah 39 mata. Dagangan menjual adalah lebih baik untuk
Carta masa M5 dan M15 mungkin mempunyai lebih banyak titik kemasukan palsu.
Open chart in a new window