Corak sebenar

Bearish Symmetrical Triangle
was formed on 03.04 at 04:24:38 (UTC+0)
signal strength 1 of 5
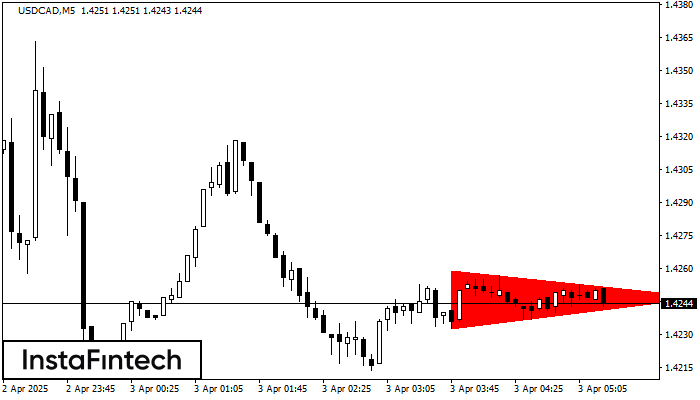
According to the chart of M5, USDCAD formed the Bearish Symmetrical Triangle pattern. Trading recommendations: A breach of the lower border 1.4233 is likely to encourage a continuation of the downward trend.
The M5 and M15 time frames may have more false entry points.
Juga lihat
- All
- All
- Bearish Rectangle
- Bearish Symmetrical Triangle
- Bearish Symmetrical Triangle
- Bullish Rectangle
- Double Top
- Double Top
- Triple Bottom
- Triple Bottom
- Triple Top
- Triple Top
- All
- All
- Buy
- Sale
- All
- 1
- 2
- 3
- 4
- 5
Double Bottom
was formed on 14.04 at 04:45:49 (UTC+0)
signal strength 1 of 5

The Double Bottom pattern has been formed on NZDCAD M5. This formation signals a reversal of the trend from downwards to upwards. The signal is that a buy trade should
The M5 and M15 time frames may have more false entry points.
Open chart in a new window
Bullish Rectangle
was formed on 14.04 at 04:08:09 (UTC+0)
signal strength 2 of 5
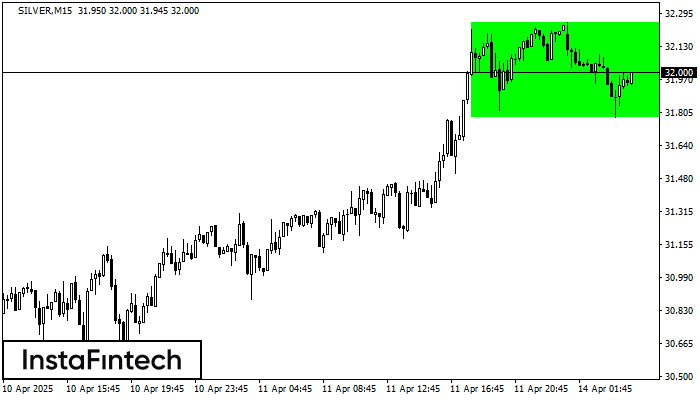
According to the chart of M15, SILVER formed the Bullish Rectangle. This type of a pattern indicates a trend continuation. It consists of two levels: resistance 32.25 and support 31.78
The M5 and M15 time frames may have more false entry points.
Open chart in a new window
Bullish Symmetrical Triangle
was formed on 14.04 at 04:00:58 (UTC+0)
signal strength 4 of 5

According to the chart of H1, EURNZD formed the Bullish Symmetrical Triangle pattern. Description: This is the pattern of a trend continuation. 2.0005 and 1.9118 are the coordinates
Open chart in a new window