Corak sebenar

Bullish Rectangle
was formed on 31.03 at 14:32:37 (UTC+0)
signal strength 1 of 5

According to the chart of M5, #Bitcoin formed the Bullish Rectangle which is a pattern of a trend continuation. The pattern is contained within the following borders: the lower border 81857.61 – 81857.61 and upper border 82250.14 – 82250.14. In case the upper border is broken, the instrument is likely to follow the upward trend.
The M5 and M15 time frames may have more false entry points.
Juga lihat
- All
- All
- Bearish Rectangle
- Bearish Symmetrical Triangle
- Bearish Symmetrical Triangle
- Bullish Rectangle
- Double Top
- Double Top
- Triple Bottom
- Triple Bottom
- Triple Top
- Triple Top
- All
- All
- Buy
- Sale
- All
- 1
- 2
- 3
- 4
- 5
Double Top
was formed on 07.04 at 09:09:57 (UTC+0)
signal strength 1 of 5
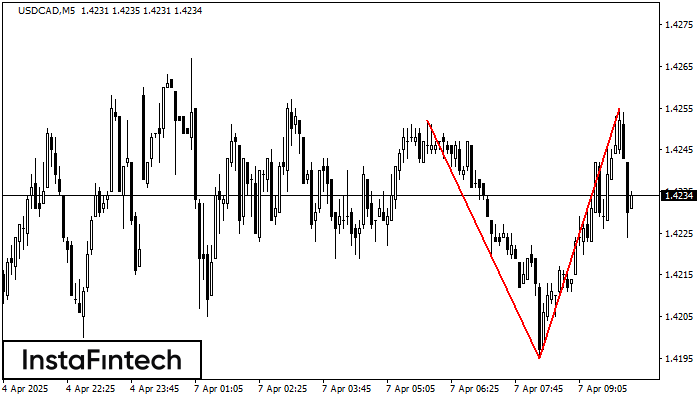
Pada carta USDCAD M5 corak pembalikan Double Top telah terbentuk. Ciri-ciri: sempadan atas 1.4255; sempadan bawah 1.4195; lebar corak 60 mata. Isyarat: penembusan sempadan bawah akan menyebabkan kesinambungan arah aliran
Carta masa M5 dan M15 mungkin mempunyai lebih banyak titik kemasukan palsu.
Open chart in a new window
Double Top
was formed on 07.04 at 09:00:14 (UTC+0)
signal strength 1 of 5
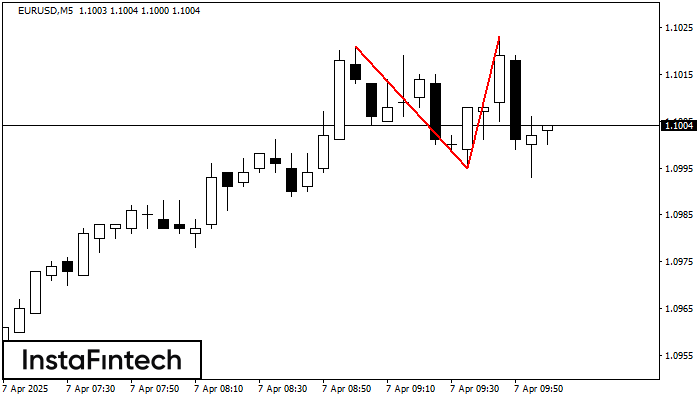
Pada carta EURUSD M5 corak pembalikan Double Top telah terbentuk. Ciri-ciri: sempadan atas 1.1023; sempadan bawah 1.0995; lebar corak 28 mata. Isyarat: penembusan sempadan bawah akan menyebabkan kesinambungan arah aliran
Carta masa M5 dan M15 mungkin mempunyai lebih banyak titik kemasukan palsu.
Open chart in a new window
Double Bottom
was formed on 07.04 at 08:55:04 (UTC+0)
signal strength 1 of 5
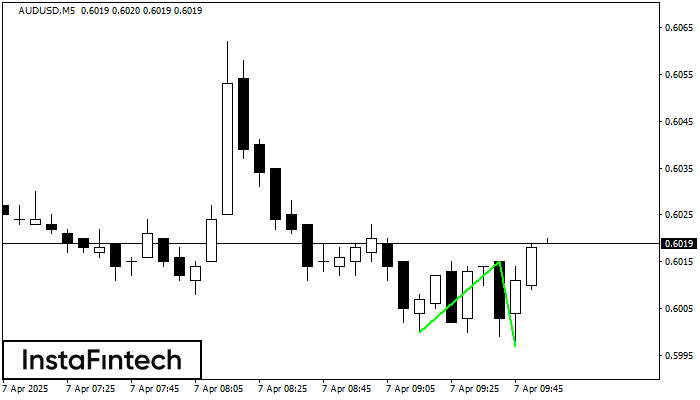
Corak Double Bottom telah dibentuk pada AUDUSD M5; sempadan atas adalah 0.6015; sempadan bawah adalah 0.5997. Lebar corak adalah 15 mata. Sekiranya penembusan sempadan atas 0.6015, perubahan aliran boleh diramalkan
Carta masa M5 dan M15 mungkin mempunyai lebih banyak titik kemasukan palsu.
Open chart in a new window