Corak sebenar

Bullish Symmetrical Triangle
was formed on 31.03 at 13:59:41 (UTC+0)
signal strength 1 of 5
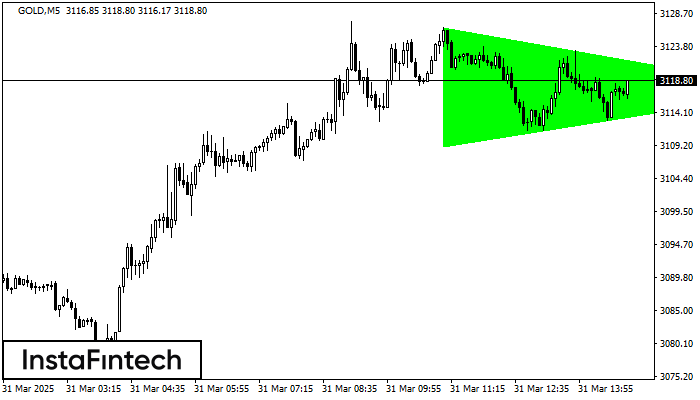
According to the chart of M5, GOLD formed the Bullish Symmetrical Triangle pattern. The lower border of the pattern touches the coordinates 3109.07/3117.44 whereas the upper border goes across 3126.71/3117.44. If the Bullish Symmetrical Triangle pattern is in progress, this evidently signals a further upward trend. In other words, in case the scenario comes true, the price of GOLD will breach the upper border to head for 3117.59.
The M5 and M15 time frames may have more false entry points.
Juga lihat
- All
- All
- Bearish Rectangle
- Bearish Symmetrical Triangle
- Bearish Symmetrical Triangle
- Bullish Rectangle
- Double Top
- Double Top
- Triple Bottom
- Triple Bottom
- Triple Top
- Triple Top
- All
- All
- Buy
- Sale
- All
- 1
- 2
- 3
- 4
- 5
Bearish pennant
was formed on 21.04 at 17:59:57 (UTC+0)
signal strength 3 of 5
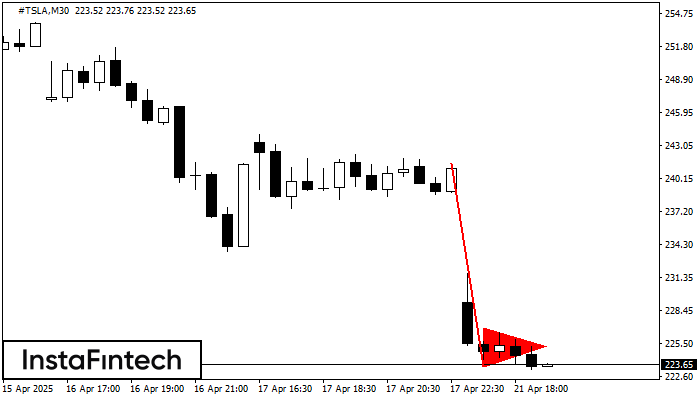
The Bearish pennant pattern has formed on the #TSLA M30 chart. It signals potential continuation of the existing trend. Specifications: the pattern’s bottom has the coordinate of 223.47; the projection
Open chart in a new window
Bearish pennant
was formed on 21.04 at 17:59:42 (UTC+0)
signal strength 3 of 5
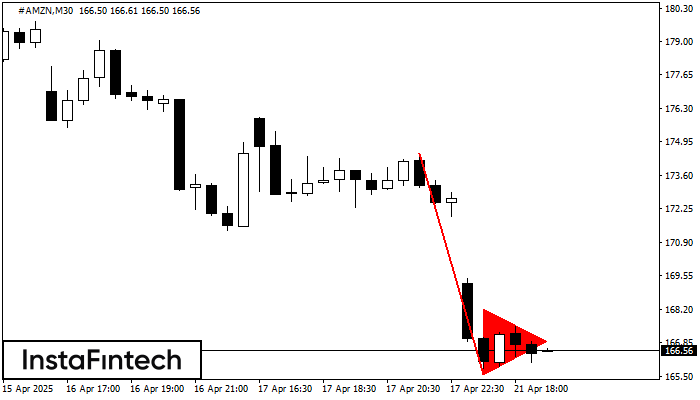
The Bearish pennant pattern has formed on the #AMZN M30 chart. This pattern type is characterized by a slight slowdown after which the price will move in the direction
Open chart in a new window
Double Bottom
was formed on 21.04 at 17:50:17 (UTC+0)
signal strength 1 of 5
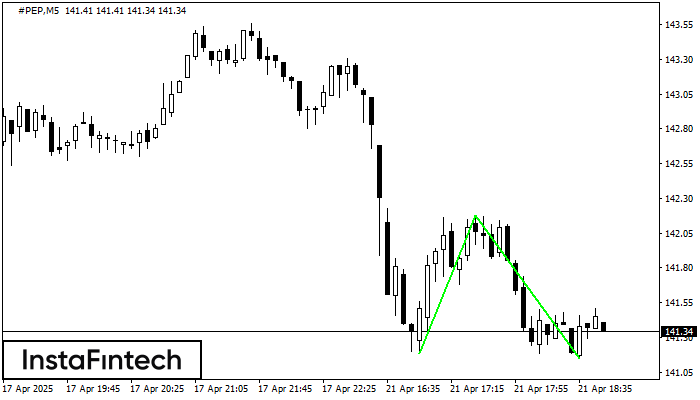
The Double Bottom pattern has been formed on #PEP M5. This formation signals a reversal of the trend from downwards to upwards. The signal is that a buy trade should
The M5 and M15 time frames may have more false entry points.
Open chart in a new window