Corak sebenar

Double Bottom
was formed on 29.03 at 11:00:31 (UTC+0)
signal strength 3 of 5

The Double Bottom pattern has been formed on #Bitcoin M30. Characteristics: the support level 83552.05; the resistance level 84588.82; the width of the pattern 103677 points. If the resistance level is broken, a change in the trend can be predicted with the first target point lying at the distance of 96966 points.
Juga lihat
- All
- All
- Bearish Rectangle
- Bearish Symmetrical Triangle
- Bearish Symmetrical Triangle
- Bullish Rectangle
- Double Top
- Double Top
- Triple Bottom
- Triple Bottom
- Triple Top
- Triple Top
- All
- All
- Buy
- Sale
- All
- 1
- 2
- 3
- 4
- 5
Fundo duplo
was formed on 10.04 at 23:00:28 (UTC+0)
signal strength 1 of 5
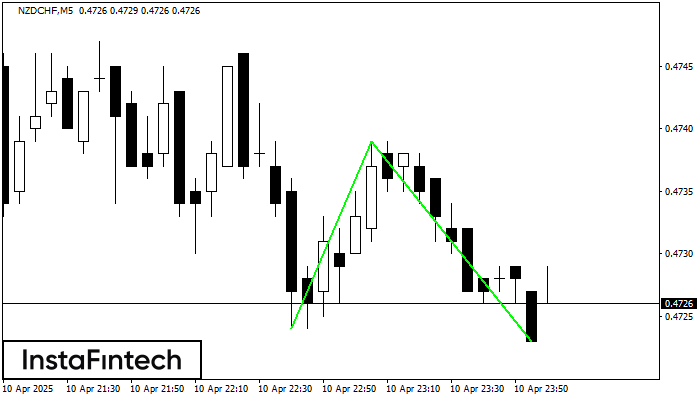
O padrão Fundo duplo foi formado em NZDCHF M5. Características: o nível de suporte 0.4724; o nível de resistência 0.4739; a largura do padrão 15 pontos. Se o nível
Os intervalos M5 e M15 podem ter mais pontos de entrada falsos.
Open chart in a new window
Triângulo Simétrico de Baixa
was formed on 10.04 at 22:58:48 (UTC+0)
signal strength 1 of 5
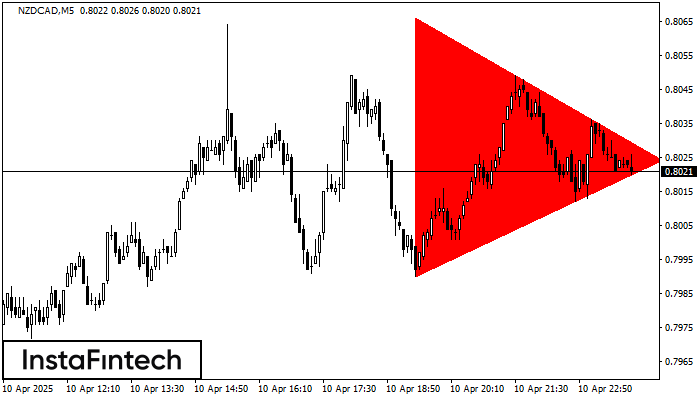
De acordo com o gráfico de M5, NZDCAD fomrou o padrão de Triângulo Simétrico de Baixa. Este padrão sinaliza uma nova tendência de baixa se o limite inferior 0.7990
Os intervalos M5 e M15 podem ter mais pontos de entrada falsos.
Open chart in a new window
Retângulo de alta
was formed on 10.04 at 22:51:41 (UTC+0)
signal strength 1 of 5
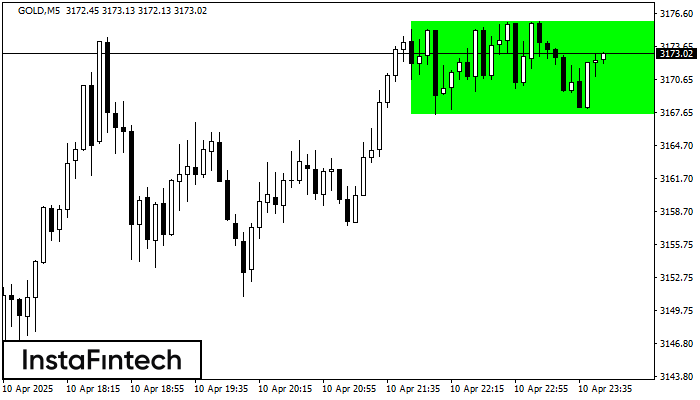
Conforme o gráfico de M5, GOLD formou o Retângulo de alta. Este tipo de padrão indica uma continuação da tendência. Ele consiste em dois níveis: resistência 3175.88 e suporte 3167.51
Os intervalos M5 e M15 podem ter mais pontos de entrada falsos.
Open chart in a new window