Corak sebenar

Bullish Symmetrical Triangle
was formed on 21.03 at 22:40:31 (UTC+0)
signal strength 1 of 5

According to the chart of M5, AUDUSD formed the Bullish Symmetrical Triangle pattern. Description: This is the pattern of a trend continuation. 0.6279 and 0.6267 are the coordinates of the upper and lower borders respectively. The pattern width is measured on the chart at 12 pips. Outlook: If the upper border 0.6279 is broken, the price is likely to continue its move by 0.6288.
The M5 and M15 time frames may have more false entry points.
Juga lihat
- All
- All
- Bearish Rectangle
- Bearish Symmetrical Triangle
- Bearish Symmetrical Triangle
- Bullish Rectangle
- Double Top
- Double Top
- Triple Bottom
- Triple Bottom
- Triple Top
- Triple Top
- All
- All
- Buy
- Sale
- All
- 1
- 2
- 3
- 4
- 5
Pennant Aliran Menaik
was formed on 28.03 at 01:55:41 (UTC+0)
signal strength 1 of 5
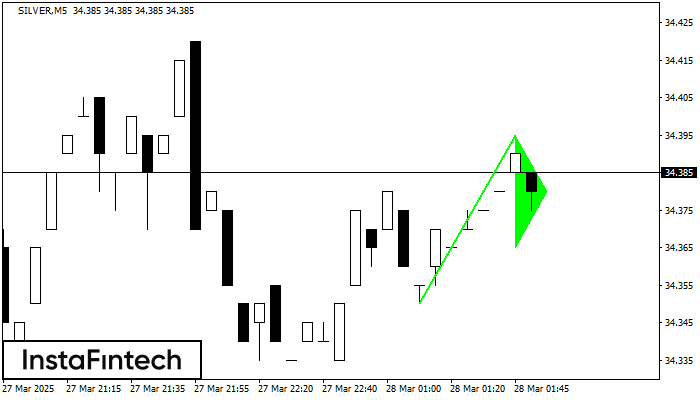
Corak Pennant Aliran Menaik adalah dibentuk pada carta SILVER M5. Ia adalah jenis corak kesinambungan. Seandainya, sekiranya harga adalah tetap di atas paras tinggi Pennant 34.40, arah aliran menaik selanjutnya
Carta masa M5 dan M15 mungkin mempunyai lebih banyak titik kemasukan palsu.
Open chart in a new window
Triple Bottom
was formed on 28.03 at 01:45:48 (UTC+0)
signal strength 2 of 5
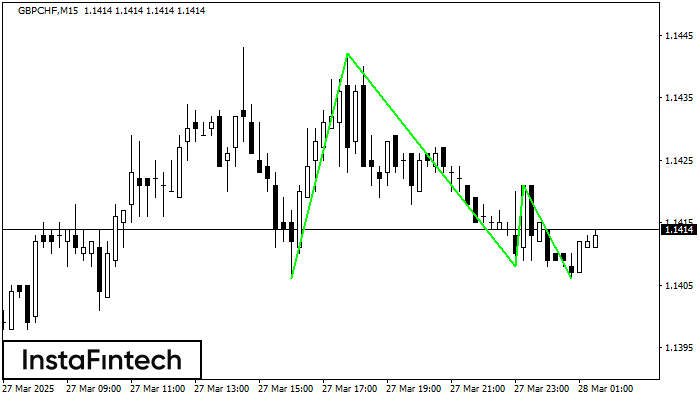
Corak Triple Bottom telah dibentuk pada carta GBPCHF M15. Ciri-ciri corak: Garisan bawah corak mempunyai koordinat 1.1442 dengan had atas 1.1442/1.1421, unjuran lebar adalah 36 mata. Pembentukan corak Triple Bottom
Carta masa M5 dan M15 mungkin mempunyai lebih banyak titik kemasukan palsu.
Open chart in a new window
Triple Top
was formed on 28.03 at 01:30:25 (UTC+0)
signal strength 3 of 5
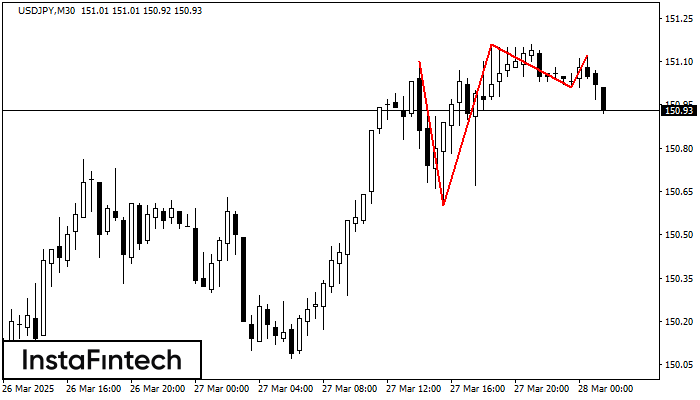
Corak Triple Top telah dibentuk pada carta bagi instrumen dagangan USDJPY M30. Ia adalah corak pembalikan yang memaparkan ciri-ciri berikut: tahap rintangan -2, tahap sokongan -41, dan lebar corak
Open chart in a new window