Corak sebenar

Bullish pennant
was formed on 19.03 at 20:32:54 (UTC+0)
signal strength 3 of 5
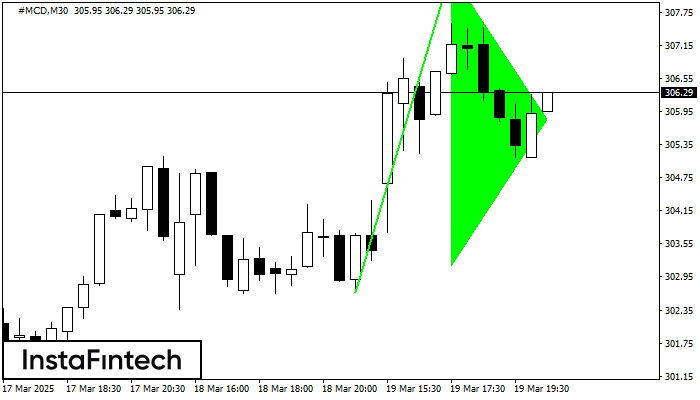
The Bullish pennant signal – Trading instrument #MCD M30, continuation pattern. Forecast: it is possible to set up a buy position above the pattern’s high of 308.46, with the prospect of the next move being a projection of the flagpole height.
Juga lihat
- All
- All
- Bearish Rectangle
- Bearish Symmetrical Triangle
- Bearish Symmetrical Triangle
- Bullish Rectangle
- Double Top
- Double Top
- Triple Bottom
- Triple Bottom
- Triple Top
- Triple Top
- All
- All
- Buy
- Sale
- All
- 1
- 2
- 3
- 4
- 5
Double Bottom
was formed on 31.03 at 15:30:34 (UTC+0)
signal strength 1 of 5
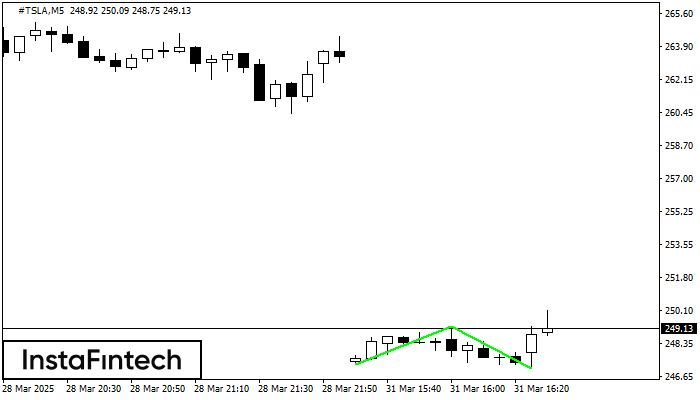
The Double Bottom pattern has been formed on #TSLA M5. This formation signals a reversal of the trend from downwards to upwards. The signal is that a buy trade should
The M5 and M15 time frames may have more false entry points.
Open chart in a new window
Double Bottom
was formed on 31.03 at 15:30:26 (UTC+0)
signal strength 1 of 5
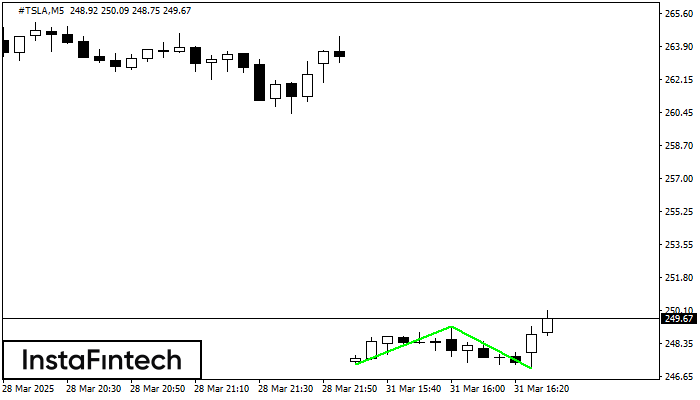
The Double Bottom pattern has been formed on #TSLA M5. This formation signals a reversal of the trend from downwards to upwards. The signal is that a buy trade should
The M5 and M15 time frames may have more false entry points.
Open chart in a new window
Bearish pennant
was formed on 31.03 at 15:25:29 (UTC+0)
signal strength 2 of 5

The Bearish pennant pattern has formed on the #AAPL M15 chart. It signals potential continuation of the existing trend. Specifications: the pattern’s bottom has the coordinate of 216.06; the projection
The M5 and M15 time frames may have more false entry points.
Open chart in a new window