Corak sebenar

Bullish Symmetrical Triangle
was formed on 19.03 at 07:49:14 (UTC+0)
signal strength 3 of 5
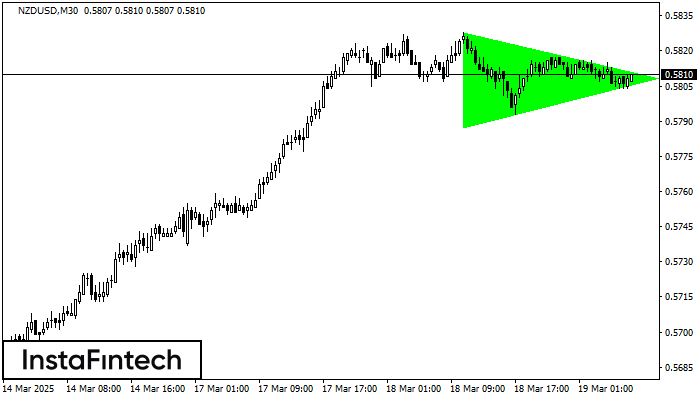
According to the chart of M30, NZDUSD formed the Bullish Symmetrical Triangle pattern. Description: This is the pattern of a trend continuation. 0.5828 and 0.5788 are the coordinates of the upper and lower borders respectively. The pattern width is measured on the chart at 40 pips. Outlook: If the upper border 0.5828 is broken, the price is likely to continue its move by 0.5838.
Juga lihat
- All
- All
- Bearish Rectangle
- Bearish Symmetrical Triangle
- Bearish Symmetrical Triangle
- Bullish Rectangle
- Double Top
- Double Top
- Triple Bottom
- Triple Bottom
- Triple Top
- Triple Top
- All
- All
- Buy
- Sale
- All
- 1
- 2
- 3
- 4
- 5
Triple Top
was formed on 31.03 at 15:15:11 (UTC+0)
signal strength 2 of 5

Corak Triple Top telah dibentuk pada carta GOLD M15. Ciri corak: sempadan mempunyai sudut menaik; garisan bawah corak mempunyai koordinat 3111.43/3112.94 dengan had atas 3127.49/3126.34; unjuran lebar ialah 1606 mata
Carta masa M5 dan M15 mungkin mempunyai lebih banyak titik kemasukan palsu.
Open chart in a new window
Double Top
was formed on 31.03 at 15:00:07 (UTC+0)
signal strength 4 of 5
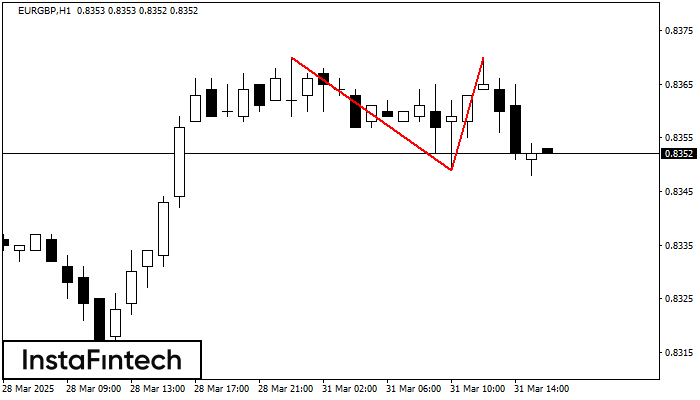
Pada carta EURGBP H1 corak pembalikan Double Top telah terbentuk. Ciri-ciri: sempadan atas 0.8370; sempadan bawah 0.8349; lebar corak 21 mata. Isyarat: penembusan sempadan bawah akan menyebabkan kesinambungan arah aliran
Open chart in a new window
Double Bottom
was formed on 31.03 at 14:45:14 (UTC+0)
signal strength 2 of 5
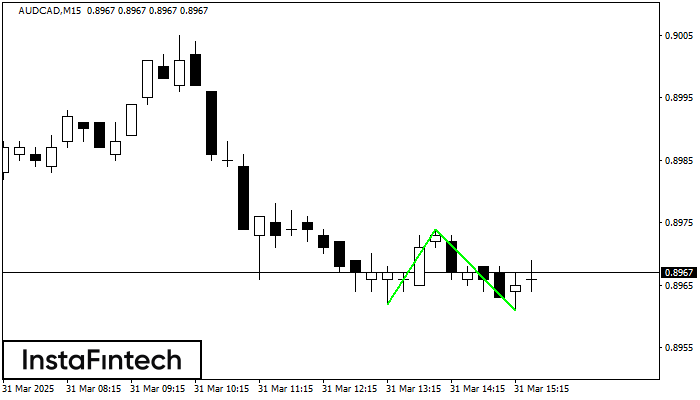
Corak Double Bottom telah dibentuk pada AUDCAD M15. Ciri-ciri: tahap sokongan 0.8962; tahap rintangan 0.8974; lebar corak 12 mata. Sekiranya tahap rintangan ditembusi, perubahan aliran boleh diramalkan dengan titik sasaran
Carta masa M5 dan M15 mungkin mempunyai lebih banyak titik kemasukan palsu.
Open chart in a new window