Lihat juga


 04.05.2023 01:55 PM
The EUR/USD pair turned to the downside today but the sell-off was only a short-lived one. Now, it's trading at 1.1067 at the time of writing. The bias remains bullish despite temporary drops. After its strong rally, a retreat was natural.
Still, today, the fundamentals should move the price. The ECB is seen as a high-impact event. As you already know, the European Central Bank is expected to increase the Main Refinancing Rate from 3.50% to 3.75%. The ECB Press Conference should bring high action, so we need to be careful.
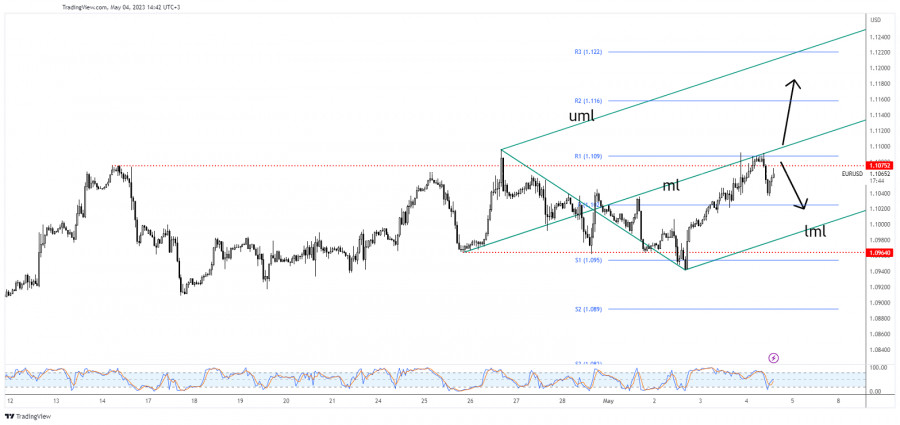
As you can see on the H1 chart, EUR/USD extended its growth after the FOMC last night. It has climbed as much as 1.1092. Still, the rate failed once again to stabilize above the 1.1075 static resistance.
It has tested and retested the median line (ml) and the weekly R1 (1.1090). These levels represent upside obstacles. Now, it has dropped a little but it has failed to reach and retest the weekly pivot point of 1.1020.
Testing and retesting the resistance levels, false breakouts may announce a new sell-off in the short term. Still, a valid breakout above 1.1075 and above the median line (ml) should confirm further growth. This could represent a new bullish signal with the first target at the R2 (1.1160).
You have already liked this post today
* Analisis pasaran yang disiarkan di sini adalah bertujuan untuk meningkatkan kesedaran anda, tetapi tidak untuk memberi arahan untuk membuat perdagangan.
Dengan kemunculan Divergence antara pergerakan harga pasangan mata wang silang AUD/JPY dengan penunjuk Pengayun Stochastic dan pergerakan harga AUD/JPY yang berada di atas WMA (30 Shift 2) yang juga mempunyai
Jika kita melihat carta 4 jam, instrumen komoditi Emas masih menunjukkan kecenderungan Menaik, namun kemunculan Perbezaan (Divergence) antara pergerakan harga Emas dan penunjuk Pengayun Stochastic memberi isyarat bahawa dalam masa
Jika kita meneliti carta 4 jam bagi pasangan silang mata wang GBP/CHF, terdapat beberapa fakta menarik. Pertama sekali, kemunculan corak Segitiga yang diiringi oleh purata bergerak eksponen EMA (21) yang
Dengan pergerakan harga pasangan mata wang silang AUD/CAD bergerak di atas WMA (21) yang mempunyai cerun menaik dan penampilan Konvergensi antara pergerakan harga AUD/CAD dan penunjuk Pengayun Stochastic, ia memberikan
Penunjuk eagle telah mencapai tahap terlebih beli. Walau bagaimanapun, logam tersebut masih boleh mencapai paras tinggi sekitar 8/8 Murray, yang mewakili rintangan kuat untuk emas. Di bawah kawasan ini, kita
Dari pemerhatian pada carta 4 jam, pasangan mata wang silang EUR/GBP kelihatan bergerak di atas EMA (100), yang menunjukkan bahawa Pembeli mendominasi pasangan mata wang ini. Oleh itu, dalam masa
Dengan kemunculan Penumpuan (Convergence) antara pergerakan harga pasangan mata wang utama USD/JPY dengan penunjuk Pengayun Stochastic serta kedudukan EMA (100) yang berada di atas harga semasa, dalam masa terdekat USD/JPY
Harga emas terus mendapat sokongan di tengah-tengah ketidakpastian yang menyelubungi hala tuju perang tarif yang dimulakan oleh Donald Trump. Harga emas telah meningkat hampir menegak selama empat bulan. Pendorong utama
Your IP address shows that you are currently located in the USA. If you are a resident of the United States, you are prohibited from using the services of InstaFintech Group including online trading, online transfers, deposit/withdrawal of funds, etc.
If you think you are seeing this message by mistake and your location is not the US, kindly proceed to the website. Otherwise, you must leave the website in order to comply with government restrictions.
Why does your IP address show your location as the USA?
Please confirm whether you are a US resident or not by clicking the relevant button below. If you choose the wrong option, being a US resident, you will not be able to open an account with InstaTrade anyway.
We are sorry for any inconvenience caused by this message.

