Lihat juga


 27.05.2022 10:48 AM
Weak GDP data may convince Fed to adjust its policy
Yesterday, the British pound followed the trajectory of the euro and strengthened against the US dollar. On Thursday, the report on US GDP for the first quarter showed negative dynamics. The world's leading economy contracted by more than expected: - 1.5% instead of an estimated -1.3%. As I have already mentioned in my review on the euro/dollar pair, the US Federal Reserve may ease its monetary tightening against this backdrop. If the economy shows signs of weakness, a hawkish approach could send it into recession. It is too early to draw such a conclusion. Judging by the FOMC minutes released this Wednesday, the regulator sees the state of the economy and the labor market as rather strong. However, everything can change.
In his speech on Thursday, UK finance minister Rishi Sunak voiced concern about high inflation, saying that the regulator has tools to keep it in control. However, not many options are left apart from tightening monetary policy by the Bank of England, which means further rate hikes. Mr. Sunak noted that the UK central bank has its own vision of monetary policy. In the coming months, members of the committee will offer more favorable conditions for attracting investment and supporting business. In general, the speech of the Chancellor of the Exchequer was quite optimistic, which was probably the factor driving the pound higher. Today, traders need to pay attention to the macroeconomic data from the US. More details are available in the Economic Calendar.
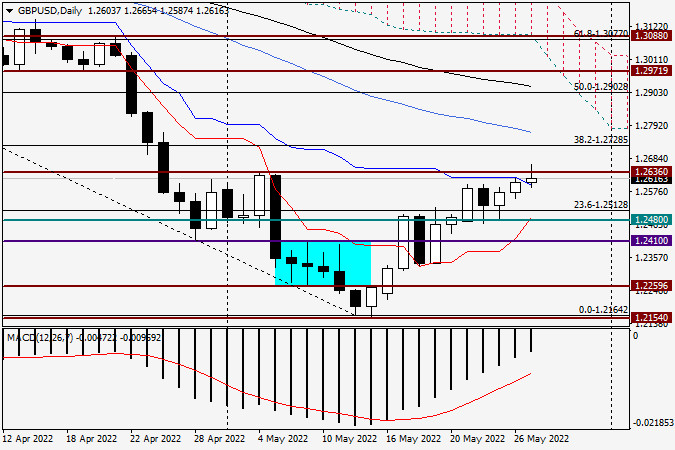
Daily chart
From the technical point of view, the GBP/USD chart remained mostly unchanged despite yesterday's growth. Yet, the sterling closed the session on Thursday above the key level of 1.2600. At the moment of writing, the pair is testing a strong resistance level located at 1.2636. Today, GBP/USD is already trading above the blue Kijun line of the Ichimoku Indicator, which also confirms the bullish trend. Although the price has already reached the daily high of 1.2665, bulls failed to settle above the resistance at 1.2636. However, they still have plenty of time to do this. It is quite possible that the macroeconomic data from the US will influence the results of the weekly session. In my opinion, the upside movement of the pair looks very likely but I wouldn't advise you to go long on a breakout of a strong resistance level, especially at the end of the week. I recommend taking a break until Monday when we analyze a full picture based on the weekly chart.
Have a good weekend!
You have already liked this post today
* Analisis pasaran yang disiarkan di sini adalah bertujuan untuk meningkatkan kesedaran anda, tetapi tidak untuk memberi arahan untuk membuat perdagangan.
Harga emas baru-baru ini mengalami pembetulan yang ketara berikutan jangkaan pasaran terhadap permulaan rundingan sebenar antara Amerika Syarikat dan China berhubung tarif serta perdagangan secara keseluruhan. Kenyataan Setiausaha Perbendaharaan
Pada carta 4 jam, instrumen komoditi Silver kelihatan meskipun keadaannya mengukuh di mana ini disahkan oleh pergerakan harga Silver yang bergerak di atas WMA (30 Shift 2) yang juga mempunyai
Walaupun pada carta 4 jam indeks Nasdaq 100 berada dalam keadaan mendatar (Sideways), julat pergerakannya masih cukup luas, sekali gus menawarkan peluang yang agak menarik pada indeks ini. Ketika
Rancangan dagangan kami untuk beberapa jam akan datang adalah menjual emas di bawah $3,333, dengan sasaran pada $3,313 dan $3,291. Kami boleh membeli di atas $3,280 dengan sasaran jangka pendek
Dengan kemunculan Divergence antara pergerakan harga pasangan mata wang silang AUD/JPY dengan penunjuk Pengayun Stochastic dan pergerakan harga AUD/JPY yang berada di atas WMA (30 Shift 2) yang juga mempunyai
Jika kita melihat carta 4 jam, instrumen komoditi Emas masih menunjukkan kecenderungan Menaik, namun kemunculan Perbezaan (Divergence) antara pergerakan harga Emas dan penunjuk Pengayun Stochastic memberi isyarat bahawa dalam masa
Jika kita meneliti carta 4 jam bagi pasangan silang mata wang GBP/CHF, terdapat beberapa fakta menarik. Pertama sekali, kemunculan corak Segitiga yang diiringi oleh purata bergerak eksponen EMA (21) yang
Dengan pergerakan harga pasangan mata wang silang AUD/CAD bergerak di atas WMA (21) yang mempunyai cerun menaik dan penampilan Konvergensi antara pergerakan harga AUD/CAD dan penunjuk Pengayun Stochastic, ia memberikan
Penunjuk eagle telah mencapai tahap terlebih beli. Walau bagaimanapun, logam tersebut masih boleh mencapai paras tinggi sekitar 8/8 Murray, yang mewakili rintangan kuat untuk emas. Di bawah kawasan ini, kita
Dari pemerhatian pada carta 4 jam, pasangan mata wang silang EUR/GBP kelihatan bergerak di atas EMA (100), yang menunjukkan bahawa Pembeli mendominasi pasangan mata wang ini. Oleh itu, dalam masa
Corak grafik
petunjuk.
Notices things
you never will!
Carta Forex
Versi-Web

Your IP address shows that you are currently located in the USA. If you are a resident of the United States, you are prohibited from using the services of InstaFintech Group including online trading, online transfers, deposit/withdrawal of funds, etc.
If you think you are seeing this message by mistake and your location is not the US, kindly proceed to the website. Otherwise, you must leave the website in order to comply with government restrictions.
Why does your IP address show your location as the USA?
Please confirm whether you are a US resident or not by clicking the relevant button below. If you choose the wrong option, being a US resident, you will not be able to open an account with InstaTrade anyway.
We are sorry for any inconvenience caused by this message.

