Өзекті паттерндер

Двойное дно
сформирован 07.04 в 10:29:41 (UTC+0)
сила сигнала 3 из 5
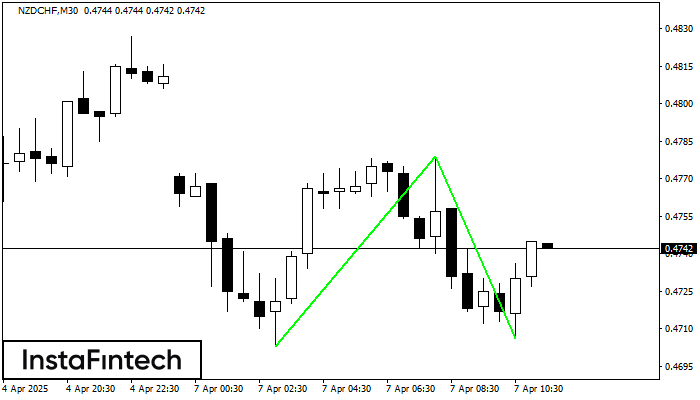
Сформирована фигура «Двойное дно» на графике NZDCHF M30. Данное формирование сигнализирует об изменении тенденции с нисходящего на восходящее движение. Сигнал: Торговую позицию на покупку следует открывать после пробоя верхней границы фигуры 0.4779, где перспектива будущего хода будет являться шириной текущей фигуры - 76 пунктов.
Сондай-ақ қараңыз
- Все
- Все
- Bearish Rectangle
- Bearish Symmetrical Triangle
- Bearish Symmetrical Triangle
- Bullish Rectangle
- Double Top
- Double Top
- Triple Bottom
- Triple Bottom
- Triple Top
- Triple Top
- Все
- Все
- Покупка
- Продажа
- Все
- 1
- 2
- 3
- 4
- 5
Triple Bottom
сформирован 13.04 в 23:50:17 (UTC+0)
сила сигнала 1 из 5
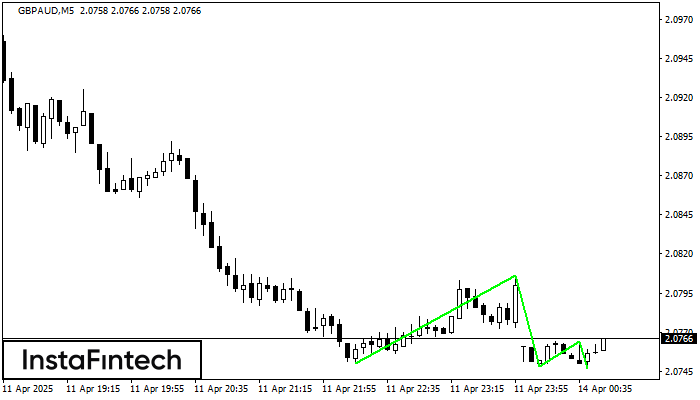
The Triple Bottom pattern has formed on the chart of GBPAUD M5. Features of the pattern: The lower line of the pattern has coordinates 2.0806 with the upper limit 2.0806/2.0764
The M5 and M15 time frames may have more false entry points.
Открыть график инструмента в новом окне
Bullish pennant
сформирован 13.04 в 23:45:13 (UTC+0)
сила сигнала 2 из 5
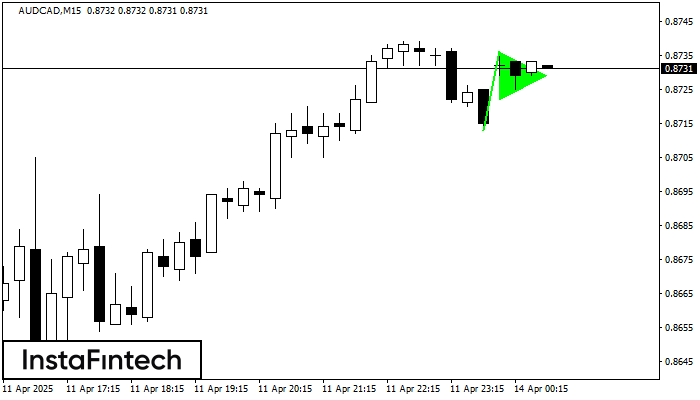
The Bullish pennant graphic pattern has formed on the AUDCAD M15 instrument. This pattern type falls under the category of continuation patterns. In this case, if the quote can breaks
The M5 and M15 time frames may have more false entry points.
Открыть график инструмента в новом окне
Bearish pennant
сформирован 13.04 в 23:45:13 (UTC+0)
сила сигнала 2 из 5
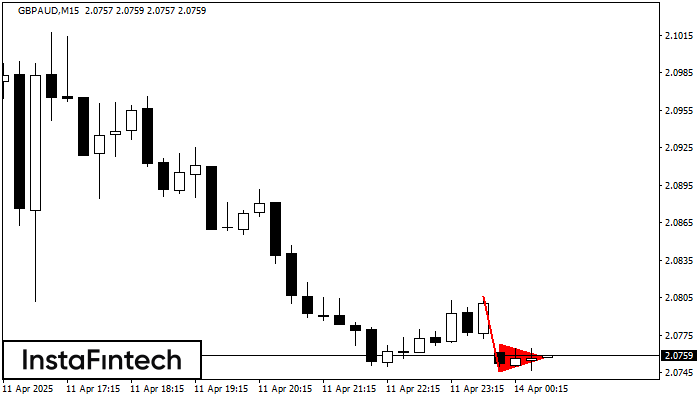
The Bearish pennant pattern has formed on the GBPAUD M15 chart. The pattern signals continuation of the downtrend in case the pennant’s low of 2.0746 is broken through. Recommendations: Place
The M5 and M15 time frames may have more false entry points.
Открыть график инструмента в новом окне