Өзекті паттерндер

Двойная вершина
сформирован 07.04 в 09:59:47 (UTC+0)
сила сигнала 3 из 5
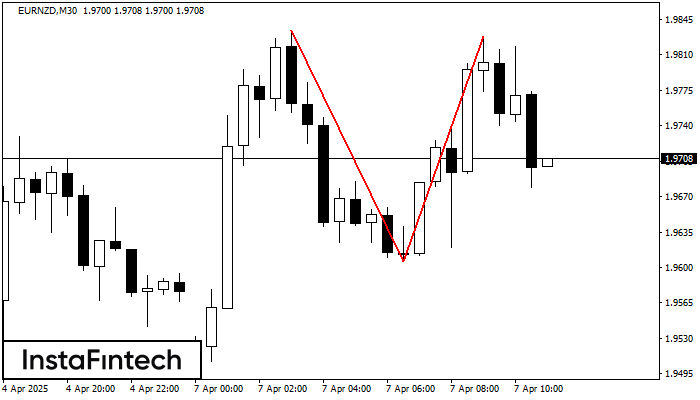
На торговом графике EURNZD M30 сформировалась разворотная фигура «Двойная вершина». Характеристика: Верхняя граница 1.9828; Нижняя граница 1.9606; Ширина фигуры 222 пунктов. Сигнал: Пробой нижней границы 1.9606 приведет к дальнейшему нисходящему движению с перспективой хода к уровню 1.9576.
Сондай-ақ қараңыз
- Все
- Все
- Bearish Rectangle
- Bearish Symmetrical Triangle
- Bearish Symmetrical Triangle
- Bullish Rectangle
- Double Top
- Double Top
- Triple Bottom
- Triple Bottom
- Triple Top
- Triple Top
- Все
- Все
- Покупка
- Продажа
- Все
- 1
- 2
- 3
- 4
- 5
Double Top
was formed on 21.04 at 20:31:25 (UTC+0)
signal strength 1 of 5
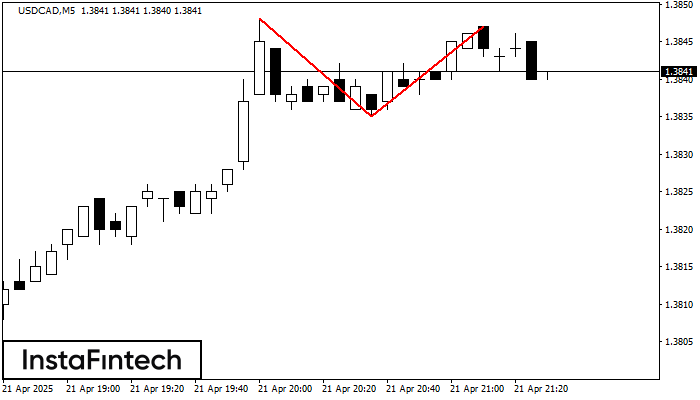
The Double Top pattern has been formed on USDCAD M5. It signals that the trend has been changed from upwards to downwards. Probably, if the base of the pattern 1.3835
The M5 and M15 time frames may have more false entry points.
Open chart in a new window
Double Bottom
was formed on 21.04 at 20:30:22 (UTC+0)
signal strength 2 of 5
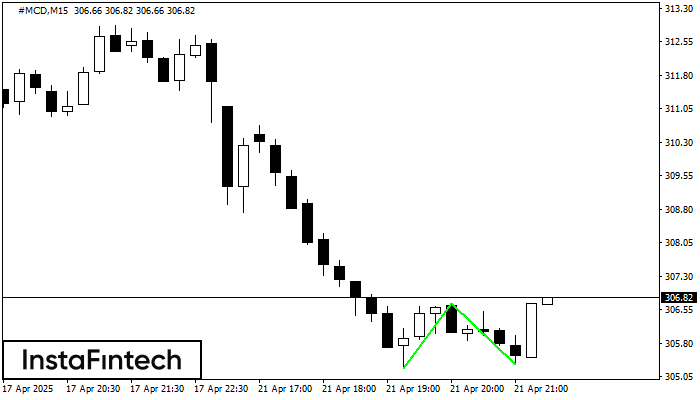
The Double Bottom pattern has been formed on #MCD M15. Characteristics: the support level 305.24; the resistance level 306.70; the width of the pattern 146 points. If the resistance level
The M5 and M15 time frames may have more false entry points.
Open chart in a new window
Double Top
was formed on 21.04 at 20:25:24 (UTC+0)
signal strength 1 of 5
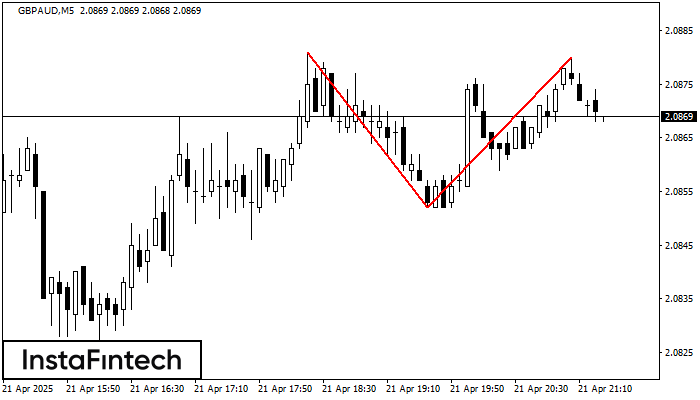
On the chart of GBPAUD M5 the Double Top reversal pattern has been formed. Characteristics: the upper boundary 2.0880; the lower boundary 2.0852; the width of the pattern 28 points
The M5 and M15 time frames may have more false entry points.
Open chart in a new window