Өзекті паттерндер

Прямоугольник
сформирован 26.03 в 14:44:13 (UTC+0)
сила сигнала 3 из 5
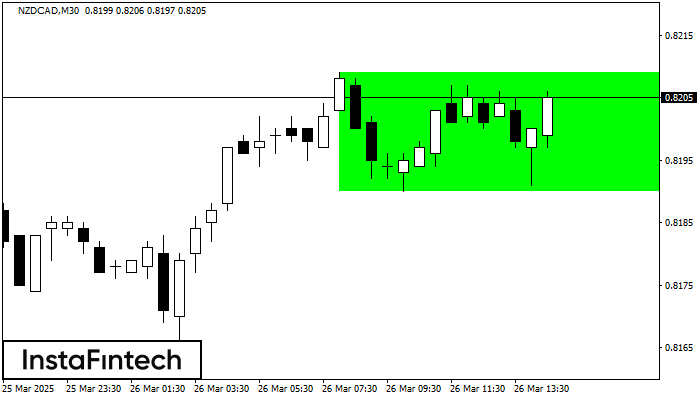
По торговому инструменту NZDCAD на M30 сформировалась фигура продолжения тренда - «Прямоугольник». Фигура имеет границы: Нижняя 0.8190; Верхняя 0.8209. В случае пробоя верхней границы вероятно дальнейшее движение в сторону тренда.
Сондай-ақ қараңыз
- Все
- Все
- Bearish Rectangle
- Bearish Symmetrical Triangle
- Bearish Symmetrical Triangle
- Bullish Rectangle
- Double Top
- Double Top
- Triple Bottom
- Triple Bottom
- Triple Top
- Triple Top
- Все
- Все
- Покупка
- Продажа
- Все
- 1
- 2
- 3
- 4
- 5
Double Bottom
сформирован 10.04 в 23:00:28 (UTC+0)
сила сигнала 1 из 5
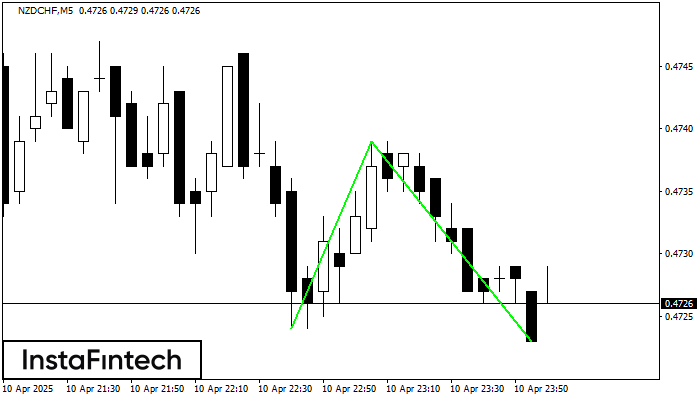
The Double Bottom pattern has been formed on NZDCHF M5. Characteristics: the support level 0.4724; the resistance level 0.4739; the width of the pattern 15 points. If the resistance level
The M5 and M15 time frames may have more false entry points.
Открыть график инструмента в новом окне
Bearish Symmetrical Triangle
сформирован 10.04 в 22:58:48 (UTC+0)
сила сигнала 1 из 5
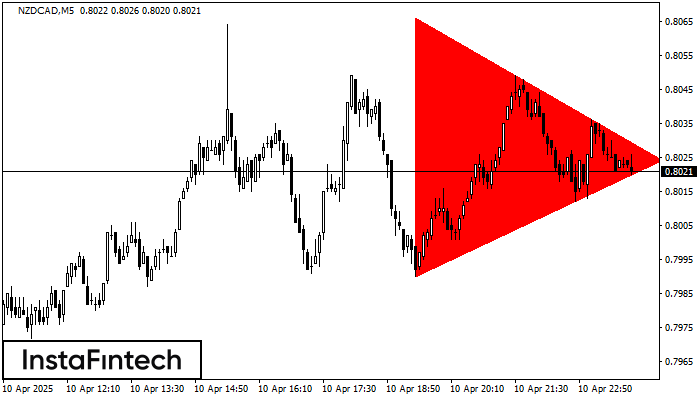
According to the chart of M5, NZDCAD formed the Bearish Symmetrical Triangle pattern. This pattern signals a further downward trend in case the lower border 0.7990 is breached. Here
The M5 and M15 time frames may have more false entry points.
Открыть график инструмента в новом окне
Bullish Rectangle
сформирован 10.04 в 22:51:41 (UTC+0)
сила сигнала 1 из 5
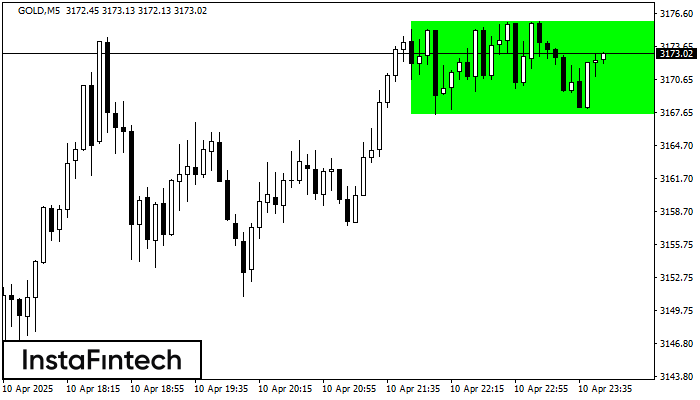
According to the chart of M5, GOLD formed the Bullish Rectangle. This type of a pattern indicates a trend continuation. It consists of two levels: resistance 3175.88 and support 3167.51
The M5 and M15 time frames may have more false entry points.
Открыть график инструмента в новом окне