Өзекті паттерндер

Двойная вершина
сформирован 25.03 в 03:30:14 (UTC+0)
сила сигнала 3 из 5
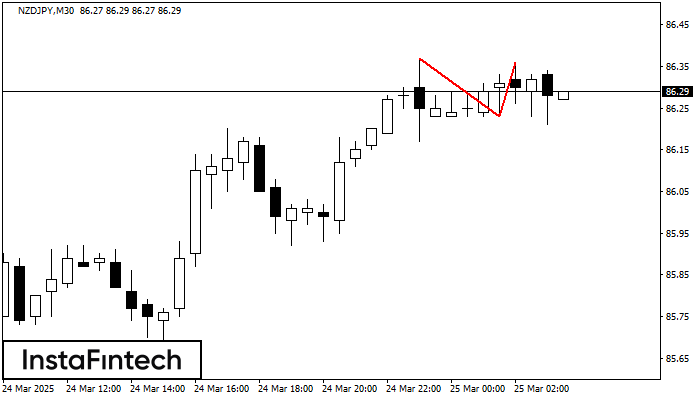
На торговом графике NZDJPY M30 сформировалась разворотная фигура «Двойная вершина». Характеристика: Верхняя граница 86.36; Нижняя граница 86.23; Ширина фигуры 13 пунктов. Сигнал: Пробой нижней границы 86.23 приведет к дальнейшему нисходящему движению с перспективой хода к уровню 85.93.
Сондай-ақ қараңыз
- Все
- Все
- Bearish Rectangle
- Bearish Symmetrical Triangle
- Bearish Symmetrical Triangle
- Bullish Rectangle
- Double Top
- Double Top
- Triple Bottom
- Triple Bottom
- Triple Top
- Triple Top
- Все
- Все
- Покупка
- Продажа
- Все
- 1
- 2
- 3
- 4
- 5
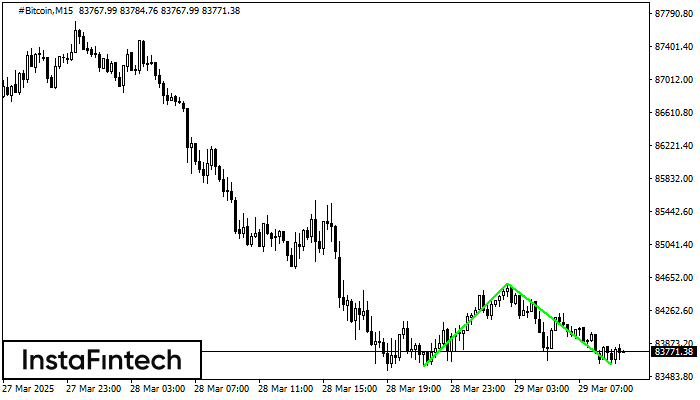
Double Bottom
сформирован 29.03 в 11:00:31 (UTC+0)
сила сигнала 3 из 5

The Double Bottom pattern has been formed on #Bitcoin M30. Characteristics: the support level 83552.05; the resistance level 84588.82; the width of the pattern 103677 points. If the resistance level
Открыть график инструмента в новом окне
Double Bottom
сформирован 29.03 в 10:15:29 (UTC+0)
сила сигнала 1 из 5

The Double Bottom pattern has been formed on #Bitcoin M5. Characteristics: the support level 83619.16; the resistance level 83858.95; the width of the pattern 23979 points. If the resistance level
The M5 and M15 time frames may have more false entry points.
Открыть график инструмента в новом окне
Double Bottom
сформирован 29.03 в 09:45:28 (UTC+0)
сила сигнала 2 из 5
The Double Bottom pattern has been formed on #Bitcoin M15. This formation signals a reversal of the trend from downwards to upwards. The signal is that a buy trade should
The M5 and M15 time frames may have more false entry points.
Открыть график инструмента в новом окне