Өзекті паттерндер

Бычий симметричный треугольник
сформирован 19.03 в 07:49:14 (UTC+0)
сила сигнала 3 из 5
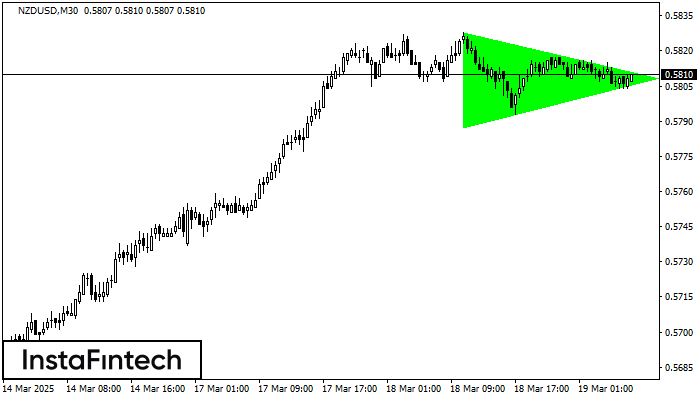
По NZDUSD на M30 фигура «Бычий симметричный треугольник». Характеристика: Фигура продолжения тренда; Координаты границ – верхняя 0.5828, нижняя 0.5788. Проекция ширины фигуры 40 пунктов. Прогноз: В случае пробоя верхней границы 0.5828 цена, вероятнее всего, продолжит движение к 0.5838.
Сондай-ақ қараңыз
- Все
- Все
- Bearish Rectangle
- Bearish Symmetrical Triangle
- Bearish Symmetrical Triangle
- Bullish Rectangle
- Double Top
- Double Top
- Triple Bottom
- Triple Bottom
- Triple Top
- Triple Top
- Все
- Все
- Покупка
- Продажа
- Все
- 1
- 2
- 3
- 4
- 5
Triple Top
was formed on 31.03 at 15:15:11 (UTC+0)
signal strength 2 of 5

The Triple Top pattern has formed on the chart of the GOLD M15. Features of the pattern: borders have an ascending angle; the lower line of the pattern
The M5 and M15 time frames may have more false entry points.
Open chart in a new window
Double Top
was formed on 31.03 at 15:00:07 (UTC+0)
signal strength 4 of 5
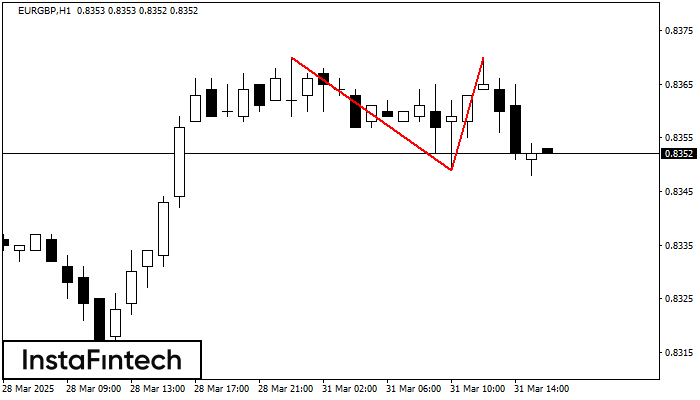
On the chart of EURGBP H1 the Double Top reversal pattern has been formed. Characteristics: the upper boundary 0.8370; the lower boundary 0.8349; the width of the pattern 21 points
Open chart in a new window
Double Bottom
was formed on 31.03 at 14:45:14 (UTC+0)
signal strength 2 of 5
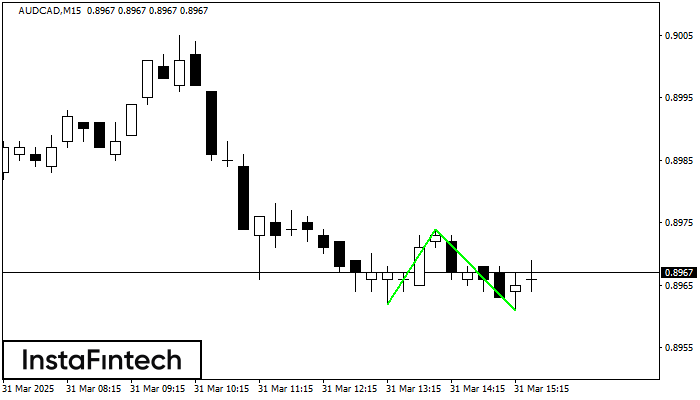
The Double Bottom pattern has been formed on AUDCAD M15. Characteristics: the support level 0.8962; the resistance level 0.8974; the width of the pattern 12 points. If the resistance level
The M5 and M15 time frames may have more false entry points.
Open chart in a new window