Pola sebenarnya

Double Bottom
was formed on 04.04 at 21:45:36 (UTC+0)
signal strength 2 of 5
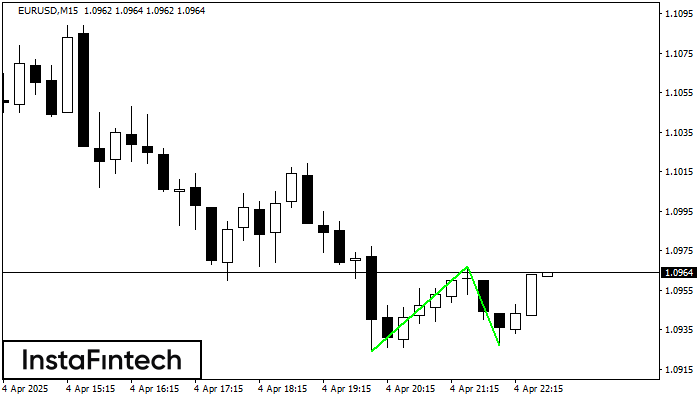
The Double Bottom pattern has been formed on EURUSD M15; the upper boundary is 1.0967; the lower boundary is 1.0927. The width of the pattern is 43 points. In case of a break of the upper boundary 1.0967, a change in the trend can be predicted where the width of the pattern will coincide with the distance to a possible take profit level.
The M5 and M15 time frames may have more false entry points.
Lihat juga
- All
- All
- Bearish Rectangle
- Bearish Symmetrical Triangle
- Bearish Symmetrical Triangle
- Bullish Rectangle
- Double Top
- Double Top
- Triple Bottom
- Triple Bottom
- Triple Top
- Triple Top
- All
- All
- Buy
- Sale
- All
- 1
- 2
- 3
- 4
- 5
Double Top
was formed on 14.04 at 00:15:19 (UTC+0)
signal strength 1 of 5
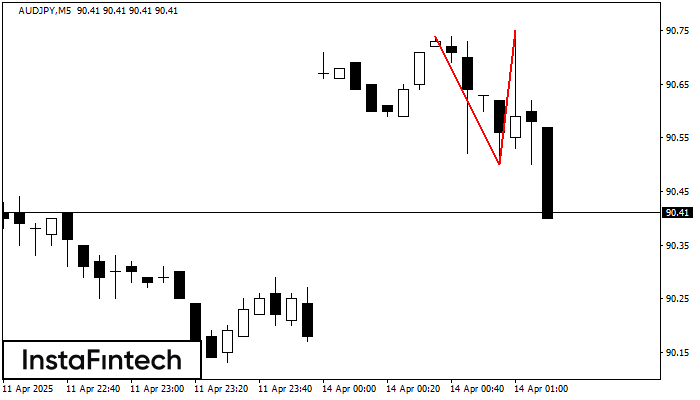
On the chart of AUDJPY M5 the Double Top reversal pattern has been formed. Characteristics: the upper boundary 90.75; the lower boundary 90.50; the width of the pattern 25 points
The M5 and M15 time frames may have more false entry points.
Open chart in a new window
Triple Top
was formed on 14.04 at 00:05:17 (UTC+0)
signal strength 1 of 5
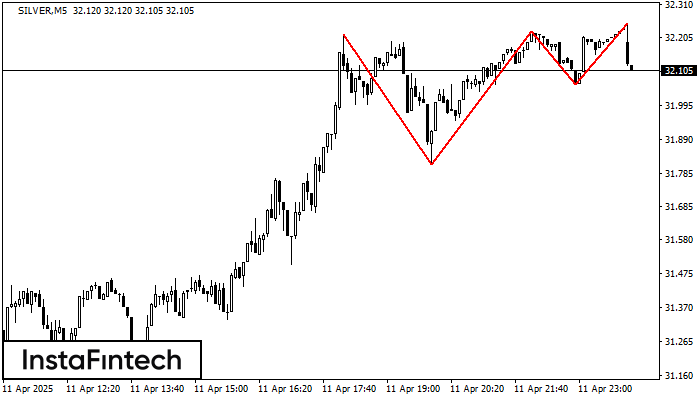
The Triple Top pattern has formed on the chart of the SILVER M5 trading instrument. It is a reversal pattern featuring the following characteristics: resistance level -35, support level -245
The M5 and M15 time frames may have more false entry points.
Open chart in a new window
Bullish Flag
was formed on 14.04 at 00:04:23 (UTC+0)
signal strength 2 of 5

The Bullish Flag pattern has been formed on the chart AUDJPY M15 which signals that the upward trend will continue. Signals: а break of the peak at 90.88 may push
The M5 and M15 time frames may have more false entry points.
Open chart in a new window