Pola sebenarnya

Double Bottom
was formed on 02.04 at 00:00:26 (UTC+0)
signal strength 3 of 5
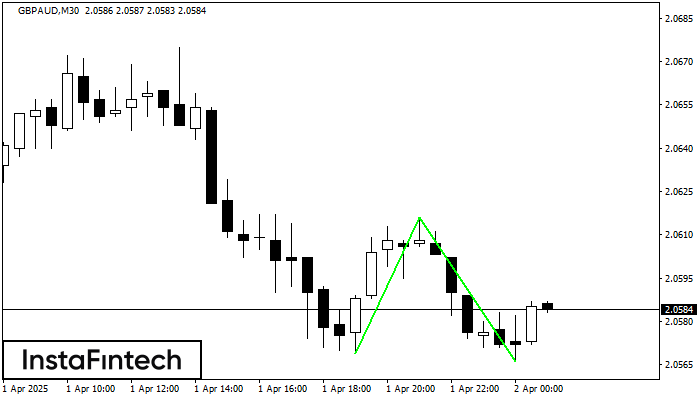
The Double Bottom pattern has been formed on GBPAUD M30; the upper boundary is 2.0616; the lower boundary is 2.0566. The width of the pattern is 47 points. In case of a break of the upper boundary 2.0616, a change in the trend can be predicted where the width of the pattern will coincide with the distance to a possible take profit level.
- All
- All
- Bearish Rectangle
- Bearish Symmetrical Triangle
- Bearish Symmetrical Triangle
- Bullish Rectangle
- Double Top
- Double Top
- Triple Bottom
- Triple Bottom
- Triple Top
- Triple Top
- All
- All
- Buy
- Sale
- All
- 1
- 2
- 3
- 4
- 5
Teratas Ganda
was formed on 21.04 at 11:20:02 (UTC+0)
signal strength 1 of 5
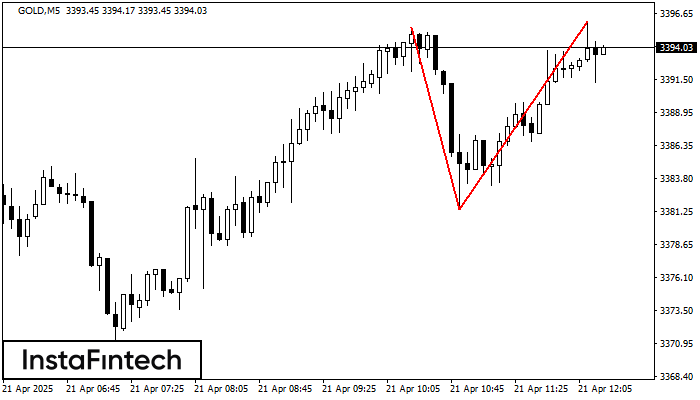
Pola reversal Teratas Ganda telah terbentuk pada GOLD M5. Karakteristik: batas atas 3395.58; batas bawah 3381.38; lebar pola 1463 poin. Transaksi jual lebih baik dibuka di bawah batas bawah 3381.38
Rangka waktu M5 dan M15 mungkin memiliki lebih dari titik entri yang keliru.
Open chart in a new window
Bawah Ganda
was formed on 21.04 at 10:30:12 (UTC+0)
signal strength 2 of 5

Pola Bawah Ganda telah terbentuk pada USDCAD M15; batas atas di 1.3801; batas bawah di 1.3791. Lebar pola sebesar 11 poin. Jika harga menembus batas atas 1.3801, Perubahan dalam tren
Rangka waktu M5 dan M15 mungkin memiliki lebih dari titik entri yang keliru.
Open chart in a new window
Panji Bullish
was formed on 21.04 at 10:10:25 (UTC+0)
signal strength 1 of 5

Sinyal Panji Bullish – instrumen trading NZDCAD M5, pola kelanjutan. Prakiraan: mungkin untuk mengatur posisi beli di atas titik tertinggi pola, di 0.8304, dengan prospek pergerakan selanjutnya menjadi proyeksi titik
Rangka waktu M5 dan M15 mungkin memiliki lebih dari titik entri yang keliru.
Open chart in a new window