Pola sebenarnya

Bearish pennant
was formed on 30.03 at 23:26:32 (UTC+0)
signal strength 1 of 5

The Bearish pennant pattern has formed on the AUDCHF M5 chart. The pattern signals continuation of the downtrend in case the pennant’s low of 0.5526 is broken through. Recommendations: Place the sell stop pending order 10 pips below the pattern’s low. Place the take profit order at the projection distance of the flagpole height.
The M5 and M15 time frames may have more false entry points.
Lihat juga
- All
- All
- Bearish Rectangle
- Bearish Symmetrical Triangle
- Bearish Symmetrical Triangle
- Bullish Rectangle
- Double Top
- Double Top
- Triple Bottom
- Triple Bottom
- Triple Top
- Triple Top
- All
- All
- Buy
- Sale
- All
- 1
- 2
- 3
- 4
- 5
Triple Bottom
was formed on 10.04 at 19:00:20 (UTC+0)
signal strength 4 of 5
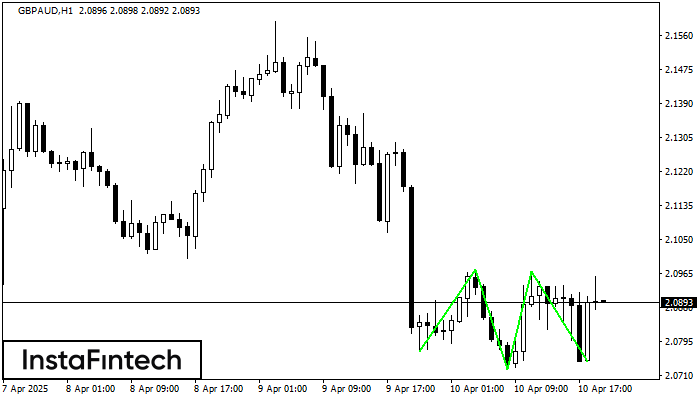
The Triple Bottom pattern has been formed on GBPAUD H1. It has the following characteristics: resistance level 2.0974/2.0969; support level 2.0768/2.0744; the width is 206 points. In the event
Open chart in a new window
Bearish Symmetrical Triangle
was formed on 10.04 at 18:50:38 (UTC+0)
signal strength 1 of 5
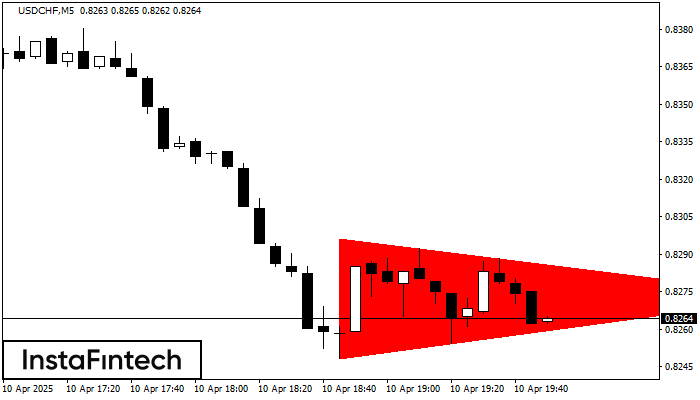
According to the chart of M5, USDCHF formed the Bearish Symmetrical Triangle pattern. Description: The lower border is 0.8248/0.8273 and upper border is 0.8296/0.8273. The pattern width is measured
The M5 and M15 time frames may have more false entry points.
Open chart in a new window
Double Bottom
was formed on 10.04 at 18:45:24 (UTC+0)
signal strength 1 of 5
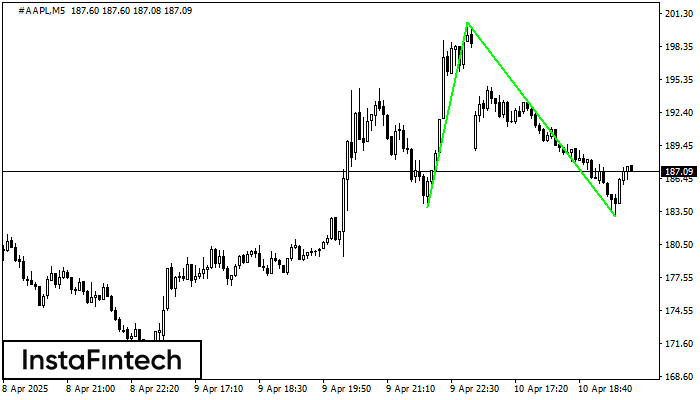
The Double Bottom pattern has been formed on #AAPL M5; the upper boundary is 200.55; the lower boundary is 183.02. The width of the pattern is 1666 points. In case
The M5 and M15 time frames may have more false entry points.
Open chart in a new window