Pola sebenarnya

Bullish Flag
was formed on 28.03 at 01:00:48 (UTC+0)
signal strength 3 of 5
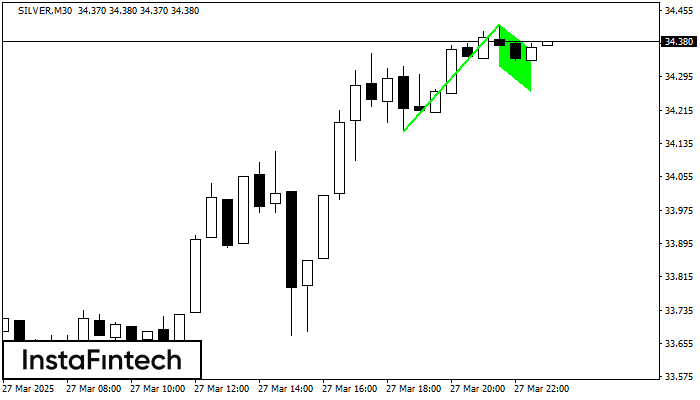
The Bullish Flag pattern has been formed on SILVER at M30. The lower boundary of the pattern is located at 34.32/34.26, while the higher boundary lies at 34.42/34.36. The projection of the flagpole is 255 points. This formation signals that the upward trend is most likely to continue. Therefore, if the level of 34.42 is broken, the price will move further upwards.
Lihat juga
- All
- All
- Bearish Rectangle
- Bearish Symmetrical Triangle
- Bearish Symmetrical Triangle
- Bullish Rectangle
- Double Top
- Double Top
- Triple Bottom
- Triple Bottom
- Triple Top
- Triple Top
- All
- All
- Buy
- Sale
- All
- 1
- 2
- 3
- 4
- 5
Double Top
was formed on 07.04 at 09:59:47 (UTC+0)
signal strength 3 of 5
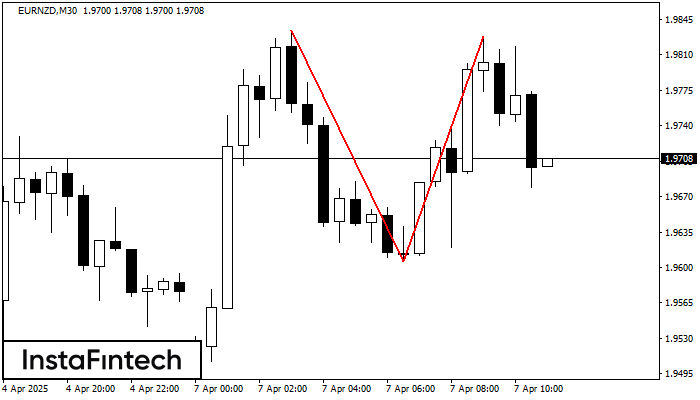
On the chart of EURNZD M30 the Double Top reversal pattern has been formed. Characteristics: the upper boundary 1.9828; the lower boundary 1.9606; the width of the pattern 222 points
Open chart in a new window
Double Top
was formed on 07.04 at 09:09:57 (UTC+0)
signal strength 1 of 5
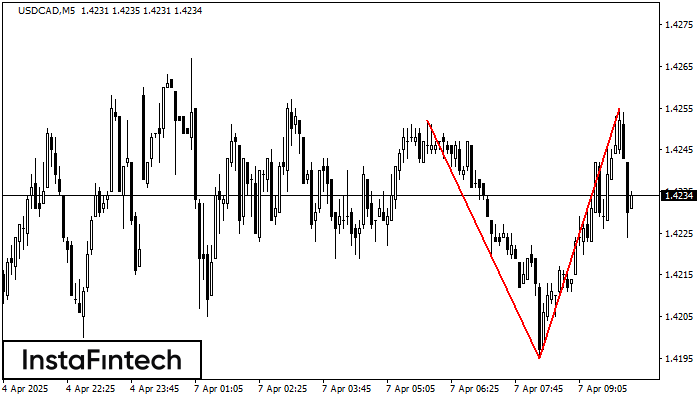
On the chart of USDCAD M5 the Double Top reversal pattern has been formed. Characteristics: the upper boundary 1.4255; the lower boundary 1.4195; the width of the pattern 60 points
The M5 and M15 time frames may have more false entry points.
Open chart in a new window
Double Top
was formed on 07.04 at 09:00:14 (UTC+0)
signal strength 1 of 5
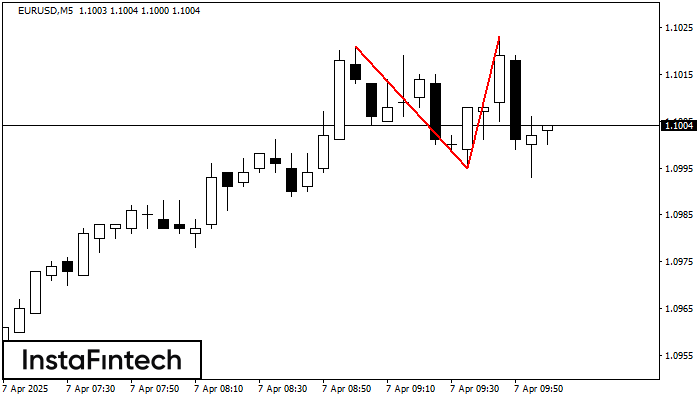
On the chart of EURUSD M5 the Double Top reversal pattern has been formed. Characteristics: the upper boundary 1.1023; the lower boundary 1.0995; the width of the pattern 28 points
The M5 and M15 time frames may have more false entry points.
Open chart in a new window