Pola sebenarnya

Bearish Symmetrical Triangle
was formed on 25.03 at 09:01:43 (UTC+0)
signal strength 2 of 5

According to the chart of M15, NZDCAD formed the Bearish Symmetrical Triangle pattern. This pattern signals a further downward trend in case the lower border 0.8172 is breached. Here, a hypothetical profit will equal the width of the available pattern that is -37 pips.
The M5 and M15 time frames may have more false entry points.
Lihat juga
- All
- All
- Bearish Rectangle
- Bearish Symmetrical Triangle
- Bearish Symmetrical Triangle
- Bullish Rectangle
- Double Top
- Double Top
- Triple Bottom
- Triple Bottom
- Triple Top
- Triple Top
- All
- All
- Buy
- Sale
- All
- 1
- 2
- 3
- 4
- 5
Panji Bearish
was formed on 31.03 at 16:00:21 (UTC+0)
signal strength 1 of 5

Pola Panji Bearish telah terbentuk di grafik #AMZN M5. Pola ini memberikan sinyal potensi kelanjutan tren yang ada. Spesifikasi: titik terendah pola berkoordinat di 184.25; proyeksi titik tertinggi sama dengan
Rangka waktu M5 dan M15 mungkin memiliki lebih dari titik entri yang keliru.
Open chart in a new window
Teratas Ganda
was formed on 31.03 at 16:00:13 (UTC+0)
signal strength 3 of 5
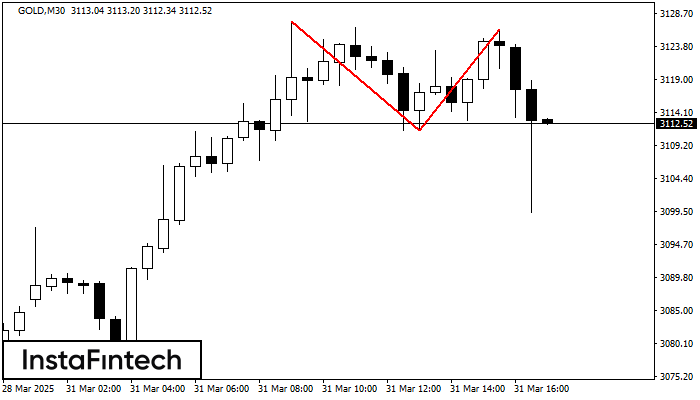
Pola reversal Teratas Ganda telah terbentuk pada GOLD M30. Karakteristik: batas atas 3127.49; batas bawah 3111.43; lebar pola 1491 poin. Transaksi jual lebih baik dibuka di bawah batas bawah 3111.43
Open chart in a new window
Bawah Ganda
was formed on 31.03 at 15:30:34 (UTC+0)
signal strength 1 of 5
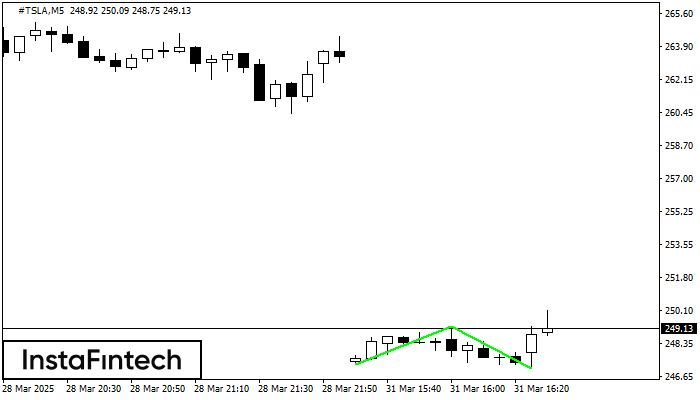
Pola Bawah Ganda telah terbentuk pada #TSLA M5. Formasi ini mensinyalkan reversal tren dari arah penurunan ke arah kenaikan. Sinyal menunjukkan bahwa transaksi beli harus dibuka setelah batas atas pola
Rangka waktu M5 dan M15 mungkin memiliki lebih dari titik entri yang keliru.
Open chart in a new window