Pola sebenarnya

Double Top
was formed on 25.03 at 03:30:14 (UTC+0)
signal strength 3 of 5
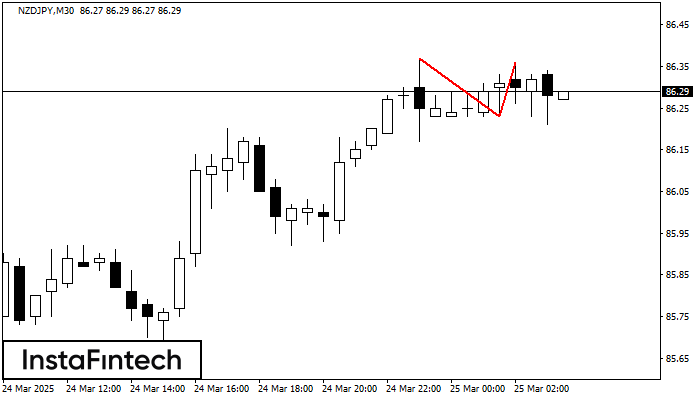
On the chart of NZDJPY M30 the Double Top reversal pattern has been formed. Characteristics: the upper boundary 86.36; the lower boundary 86.23; the width of the pattern 13 points. The signal: a break of the lower boundary will cause continuation of the downward trend targeting the 85.93 level.
- All
- All
- Bearish Rectangle
- Bearish Symmetrical Triangle
- Bearish Symmetrical Triangle
- Bullish Rectangle
- Double Top
- Double Top
- Triple Bottom
- Triple Bottom
- Triple Top
- Triple Top
- All
- All
- Buy
- Sale
- All
- 1
- 2
- 3
- 4
- 5
Bearish Rectangle
сформирован 27.03 в 06:07:54 (UTC+0)
сила сигнала 1 из 5

According to the chart of M5, USDJPY formed the Bearish Rectangle. The pattern indicates a trend continuation. The upper border is 150.29, the lower border is 150.10. The signal means
The M5 and M15 time frames may have more false entry points.
Открыть график инструмента в новом окне
Double Top
сформирован 27.03 в 05:23:08 (UTC+0)
сила сигнала 1 из 5
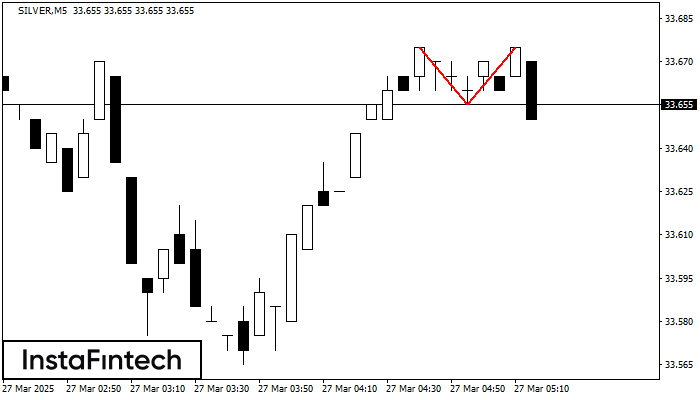
The Double Top reversal pattern has been formed on SILVER M5. Characteristics: the upper boundary 33.67; the lower boundary 33.66; the width of the pattern is 20 points. Sell trades
The M5 and M15 time frames may have more false entry points.
Открыть график инструмента в новом окне
Double Top
сформирован 27.03 в 04:55:37 (UTC+0)
сила сигнала 1 из 5
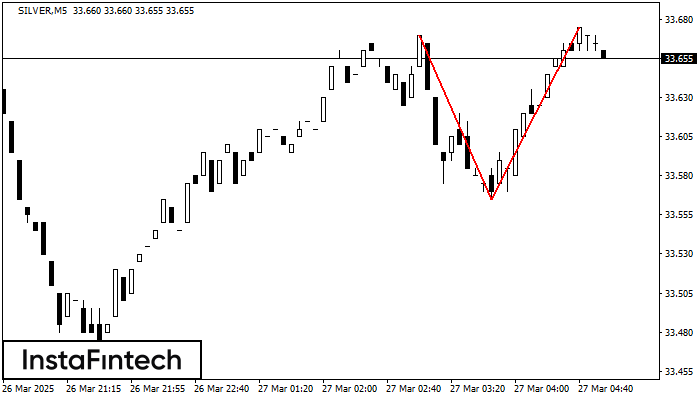
On the chart of SILVER M5 the Double Top reversal pattern has been formed. Characteristics: the upper boundary 33.67; the lower boundary 33.56; the width of the pattern 110 points
The M5 and M15 time frames may have more false entry points.
Открыть график инструмента в новом окне