

Pola sebenarnya

Bullish Symmetrical Triangle
was formed on 21.03 at 22:40:31 (UTC+0)
signal strength 1 of 5

According to the chart of M5, AUDUSD formed the Bullish Symmetrical Triangle pattern. Description: This is the pattern of a trend continuation. 0.6279 and 0.6267 are the coordinates of the upper and lower borders respectively. The pattern width is measured on the chart at 12 pips. Outlook: If the upper border 0.6279 is broken, the price is likely to continue its move by 0.6288.
The M5 and M15 time frames may have more false entry points.
Lihat juga
- All
- All
- Bearish Rectangle
- Bearish Symmetrical Triangle
- Bearish Symmetrical Triangle
- Bullish Rectangle
- Double Top
- Double Top
- Triple Bottom
- Triple Bottom
- Triple Top
- Triple Top
- All
- All
- Buy
- Sale
- All
- 1
- 2
- 3
- 4
- 5
Panji Bullish
was formed on 28.03 at 01:55:41 (UTC+0)
signal strength 1 of 5
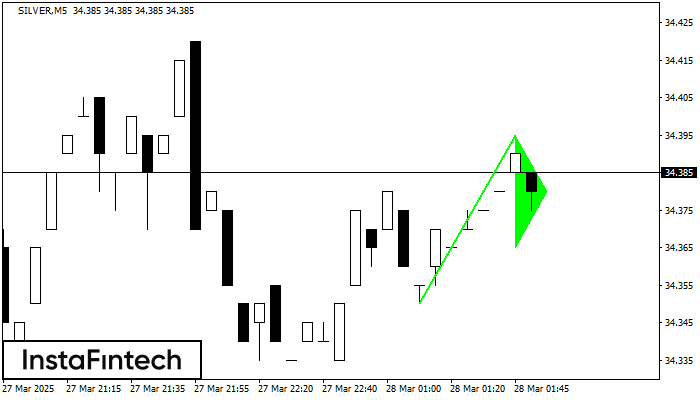
Pola Panji Bullish terbentuk di grafik SILVER M5. Ini adalah jenis pola kelanjutan. Diduga, jika harga ditetapkan di atas titik tertinggi panji di 34.40, tren naik selanjutnya mungkin terjadi
Rangka waktu M5 dan M15 mungkin memiliki lebih dari titik entri yang keliru.
Open chart in a new window
Bawah Triple
was formed on 28.03 at 01:45:48 (UTC+0)
signal strength 2 of 5
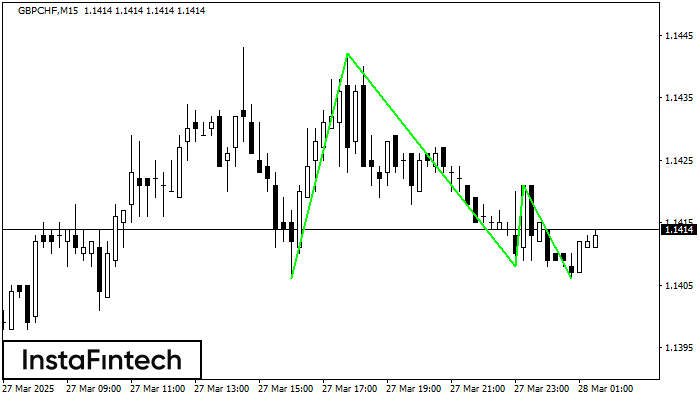
Pola Bawah Triple telah terbentuk pada grafik GBPCHF M15. Fitur-fitur pola: garis bawah pola memiliki koordinat 1.1442 dengan batas atas 1.1442/1.1421, proyeksi lebar adalah 36 poin. Pembentukan pola Bawah Triple
Rangka waktu M5 dan M15 mungkin memiliki lebih dari titik entri yang keliru.
Open chart in a new window
Teratas Triple
was formed on 28.03 at 01:30:25 (UTC+0)
signal strength 3 of 5
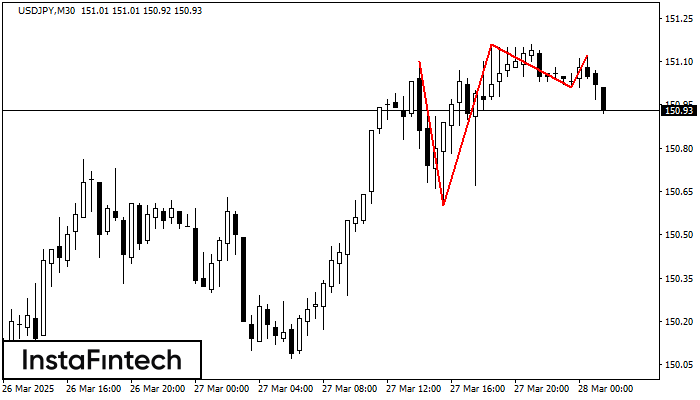
Pola Teratas Triple telah terbentuk pada grafik instrumen trading USDJPY M30. Pola tersebut merupakan pola reversal menampilkan karakteristik berikut: level resistance -2, levek support -41, dan lebar pola 50. Prakiraan
Open chart in a new window


