

Pola sebenarnya

Bullish Symmetrical Triangle
was formed on 19.03 at 18:02:02 (UTC+0)
signal strength 3 of 5
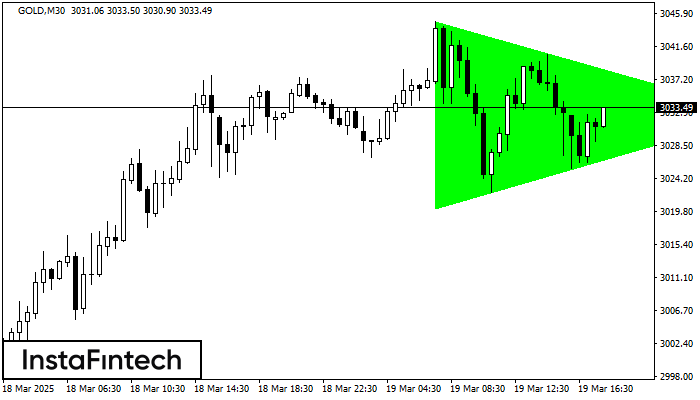
According to the chart of M30, GOLD formed the Bullish Symmetrical Triangle pattern, which signals the trend will continue. Description. The upper border of the pattern touches the coordinates 3044.87/3032.56 whereas the lower border goes across 3020.18/3032.56. The pattern width is measured on the chart at 2469 pips. If the Bullish Symmetrical Triangle pattern is in progress during the upward trend, this indicates the current trend will go on. In case 3032.56 is broken, the price could continue its move toward 3032.86.
Lihat juga
- All
- All
- Bearish Rectangle
- Bearish Symmetrical Triangle
- Bearish Symmetrical Triangle
- Bullish Rectangle
- Double Top
- Double Top
- Triple Bottom
- Triple Bottom
- Triple Top
- Triple Top
- All
- All
- Buy
- Sale
- All
- 1
- 2
- 3
- 4
- 5
Teratas Ganda
was formed on 31.03 at 15:00:07 (UTC+0)
signal strength 4 of 5
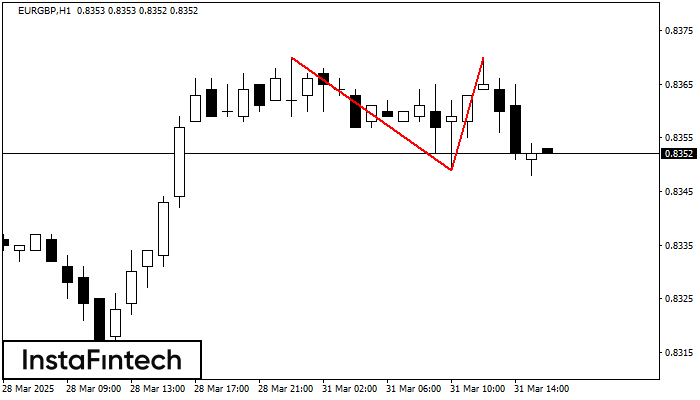
Pada grafik EURGBP H1 pola reversal Teratas Ganda telah terbentuk. Karakteristik: batas atas 0.8370; batas bawah 0.8349; lebar pola 21 poin. Sinyal: tembusan ke batas bawah akan menyebabkan kelanjutan tren
Open chart in a new window
Bawah Ganda
was formed on 31.03 at 14:45:14 (UTC+0)
signal strength 2 of 5
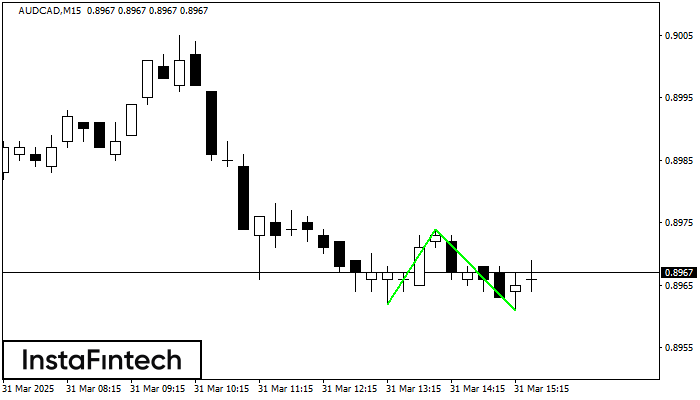
Pola Bawah Ganda telah terbentuk pada AUDCAD M15. Karakteristik: level support 0.8962; level resistance 0.8974; lebar pola 12 poin. Jika level resistance ditembus, perubahan dalam tren dapat diprediksi dengan target
Rangka waktu M5 dan M15 mungkin memiliki lebih dari titik entri yang keliru.
Open chart in a new window
Persegi Bullish
was formed on 31.03 at 14:32:37 (UTC+0)
signal strength 1 of 5

Menurut grafik dari M5, #Bitcoin terbentuk Persegi Bullish yang merupakan pola dari kelanjutan tren. Pola terkandung dalam batas berikut: batas yang lebih rendah 81857.61 – 81857.61 dan batas atas 82250.14
Rangka waktu M5 dan M15 mungkin memiliki lebih dari titik entri yang keliru.
Open chart in a new window


