Actual patterns

Patterns are graphical models which are formed in the chart by the price. According to one of the technical analysis postulates, history (price movement) repeats itself. It means that the price movements are often similar in the same situations which makes it possible to predict the further development of the situation with a high probability.
Relevant patterns by InstaTrade is an easy-to-use service which allows you to be aware of latest changes in the market and react to clues from the market in time. In our service you will always find the latest and most relevant patterns on any pair and any timeframe.
Double Bottom
was formed on 28.03 at 02:45:07 (UTC+0)
signal strength 1 of 5
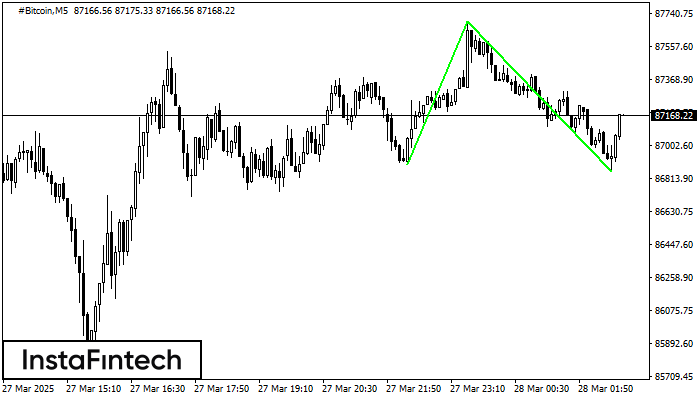
The Double Bottom pattern has been formed on #Bitcoin M5. Characteristics: the support level 86893.54; the resistance level 87696.01; the width of the pattern 80247 points. If the resistance level is broken, a change in the trend can be predicted with the first target point lying at the distance of 84049 points.
The M5 and M15 time frames may have more false entry points.
See Also
- All
- All
- Bearish Rectangle
- Bearish Symmetrical Triangle
- Bearish Symmetrical Triangle
- Bullish Rectangle
- Double Top
- Double Top
- Triple Bottom
- Triple Bottom
- Triple Top
- Triple Top
- All
- All
- Buy
- Sale
- All
- 1
- 2
- 3
- 4
- 5
Bullish pennant
was formed on 14.04 at 01:45:23 (UTC+0)
signal strength 2 of 5
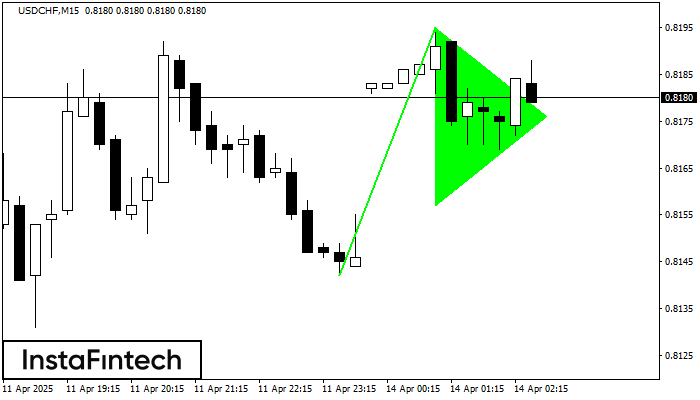
The Bullish pennant signal – Trading instrument USDCHF M15, continuation pattern. Forecast: it is possible to set up a buy position above the pattern’s high of 0.8195, with the prospect
The M5 and M15 time frames may have more false entry points.
Open chart in a new window
Double Bottom
was formed on 14.04 at 01:30:09 (UTC+0)
signal strength 2 of 5
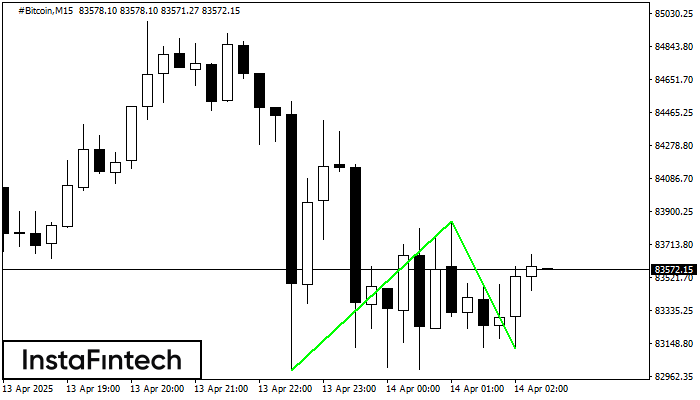
The Double Bottom pattern has been formed on #Bitcoin M15; the upper boundary is 83846.39; the lower boundary is 83118.34. The width of the pattern is 85123 points. In case
The M5 and M15 time frames may have more false entry points.
Open chart in a new window
Bullish Rectangle
was formed on 14.04 at 01:17:49 (UTC+0)
signal strength 2 of 5
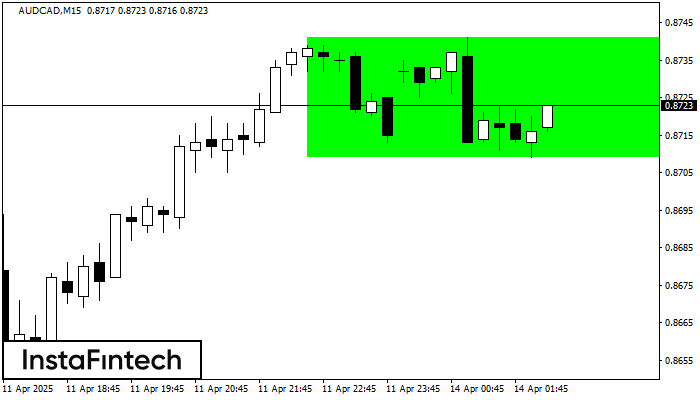
According to the chart of M15, AUDCAD formed the Bullish Rectangle. This type of a pattern indicates a trend continuation. It consists of two levels: resistance 0.8741 and support 0.8709
The M5 and M15 time frames may have more false entry points.
Open chart in a new window