Voir aussi


Le Fanion (Pennant) est une figure chartiste classique de l'analyse technique. Ce pattern se retrouve régulièrement sur les graphiques de presque toutes les paires de devises.
Son apparition indique la continuation de la tendance.
Le Fanion est une figure chartiste figure la plus courante sur de l'analyse technique qui se retrouve régulièrement sur les graphiques de plusieurs paires de devises.
L'apparition d'un fanion témoigne de la continuation de la tendance. En termes simples, le fanion indique que, malgré l'accalmie temporaire, le marché a tendance à aller plus loin dans la même direction.
Il existe deux types de la figure Fanion: haussier et baissier. Un fanion haussier se caractérise par la présence d'un mât dirigé vers le haut avec un fanion qui se forme à partir du point le plus haut. Un fanion baissier symbolise une tendance à la baisse respectivement.
La principale caractéristique de ce type de fanion est un mât en forme de série de bougies qui vont dans la même direction. Cela peut être tant la tendance ou qu'une simple impulsion. Une fois que le point d'impulsion minimum pour le marché baissier sera atteint (le point maximum pour le marché haussier), la dernière partie de la figure du fanion est formée: un triangle symétrique. Il est à noter que l'apparition du pattern se produit relativement rapidement. À ce moment, lorsque les deux lignes passant par les maxima et les minima convergent assez nettement en un seul point, formant un petit triangle, on peut déclarer sans risque la formation d'un pennant.
La stratégie optimale d'entrée sur le marché est le moment où l'une des lignes formant un triangle est franchie par le prix dans la direction de la tendance dominante par rapport au mât, c'est-à-dire dès que la bougie qui a franchi la ligne dirigée vers la tendance principale ferme, с'est le moment opportun.
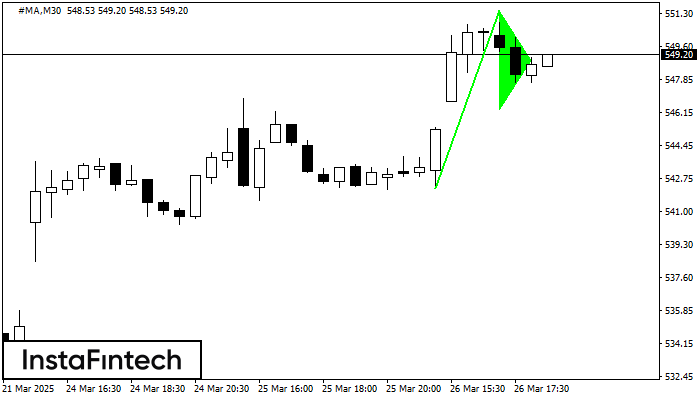
The Bullish pennant signal – Trading instrument #MA M30, continuation pattern. Forecast: it is possible to set up a buy position above the pattern’s high of 551.44, with the prospect
Open chart in a new window
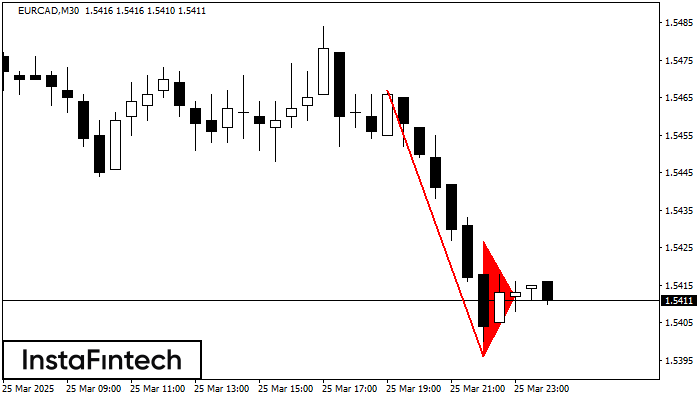
The Bearish pennant pattern has formed on the EURCAD M30 chart. The pattern signals continuation of the downtrend in case the pennant’s low of 1.5396 is broken through. Recommendations: Place
Open chart in a new window
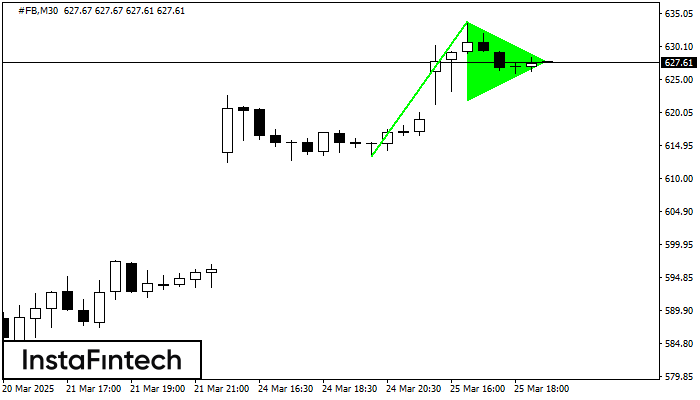
The Bullish pennant pattern is formed on the #FB M30 chart. It is a type of the continuation pattern. Supposedly, in case the price is fixed above the pennant’s high
Open chart in a new window


Your IP address shows that you are currently located in the USA. If you are a resident of the United States, you are prohibited from using the services of InstaFintech Group including online trading, online transfers, deposit/withdrawal of funds, etc.
If you think you are seeing this message by mistake and your location is not the US, kindly proceed to the website. Otherwise, you must leave the website in order to comply with government restrictions.
Why does your IP address show your location as the USA?
Please confirm whether you are a US resident or not by clicking the relevant button below. If you choose the wrong option, being a US resident, you will not be able to open an account with InstaTrade anyway.
We are sorry for any inconvenience caused by this message.