See also


 26.03.2025 11:29 AM
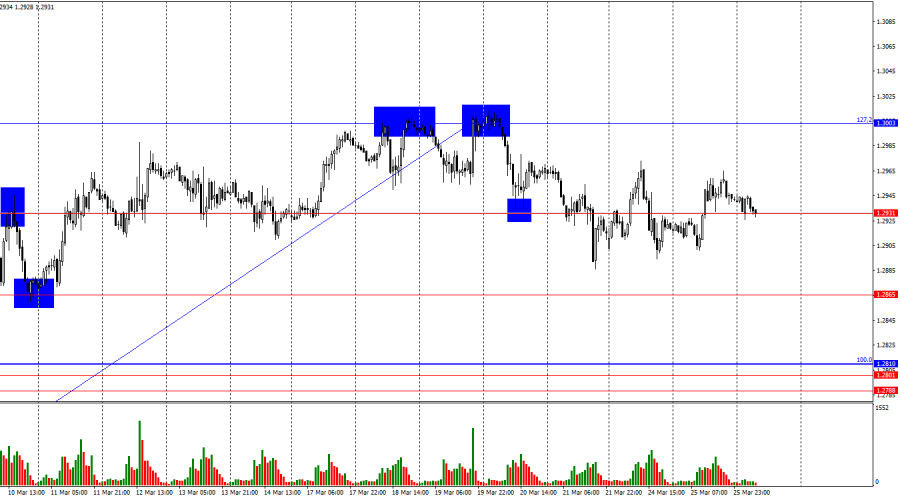
On the hourly chart, the GBP/USD pair continued to trade sideways on Tuesday, showing no reaction to the 1.2931 level. Therefore, a new close above or below this level will not be considered a trading signal. Bears have begun to counterattack, but their strength appears to be quite limited.
The wave situation is completely clear. The last completed downward wave did not break below the previous low, while the last upward wave broke above the previous high. This indicates that a "bullish" trend is still forming. Recently, the pound has shown strong growth, although the news background has not been strong enough to justify such aggressive buying. However, most traders are currently unwilling to buy the US dollar under any economic conditions, as Donald Trump continues to introduce new tariffs that will eventually impact US and global economic growth.
There was virtually no fundamental background on Tuesday, but today at least two reports deserve attention. The UK will publish its inflation report for February. Last week, the Bank of England made it clear that it expects consumer prices to accelerate, which prevents it from easing monetary policy. Therefore, a new rise in inflation would be a positive signal for the pound. If inflation decreases slightly (as forecasted), the pound may fall as well, but only modestly. In the US, today's report on durable goods orders is scheduled. There are more significant reports, but in the absence of major news, even this will draw attention. This week's news flow is weak overall, so traders must work with what they have. At the moment, the pound is trading exactly in the middle of the horizontal range, and even these two reports might not be enough to break the sideways movement.
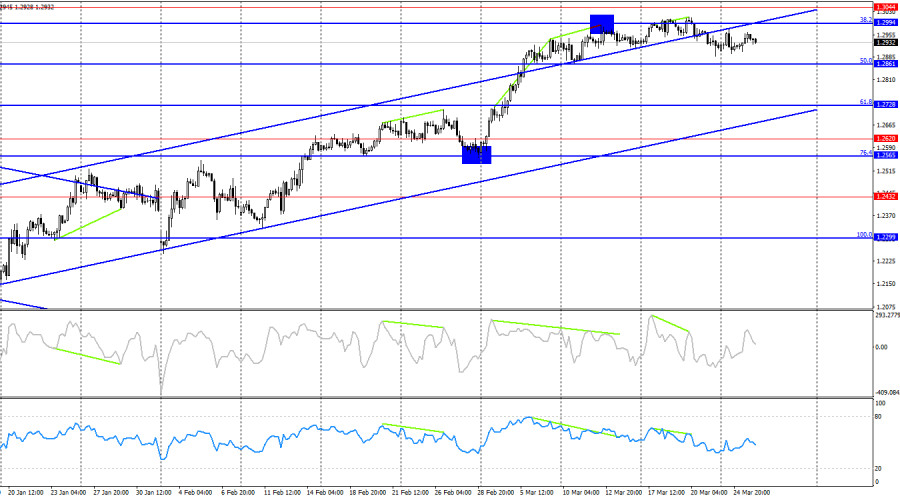
On the 4-hour chart, the pair continues its upward movement. I do not expect a strong decline in the pound unless the price closes below the ascending channel. Another "bearish" divergence has formed on the CCI indicator, which, so far, has had no impact on the bulls—just like the previous one. A rebound from the 1.2994 level could lead to a modest decline toward the 50.0% Fibonacci level at 1.2861, although the bears may not even reach this level.
Commitments of Traders (COT) Report:
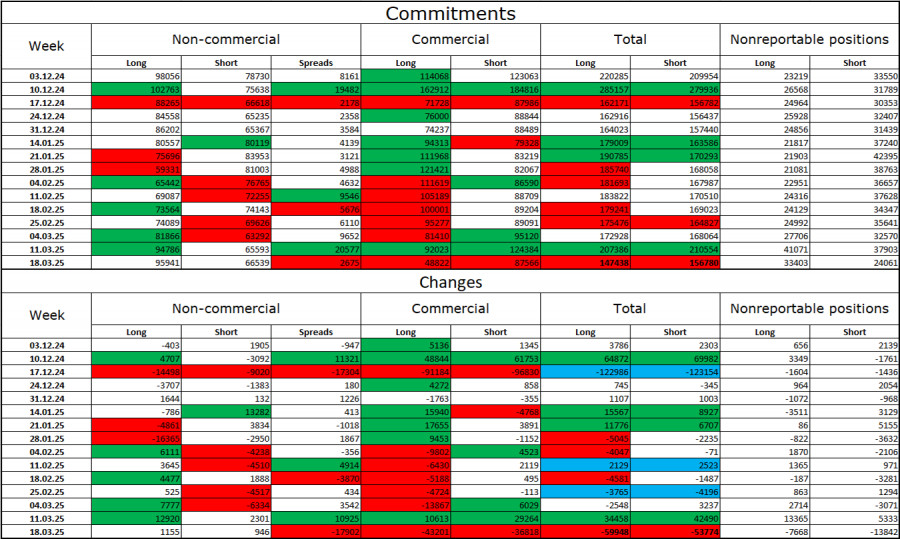
The sentiment among the "Non-commercial" trader category became more bullish in the last reporting week. The number of long positions held by speculators increased by 1,155, while short positions rose by only 946. Bears have lost their edge in the market. The gap between long and short positions now stands at nearly 30,000 in favor of the bulls: 96,000 vs. 67,000.
In my opinion, the pound still has downward potential, but recent developments may force a long-term market reversal. Over the last three months, the number of long positions decreased from 98,000 to 96,000, while short positions fell from 78,000 to 67,000. More importantly, over the past 7 weeks, long positions have increased from 59,000 to 96,000, and short positions have dropped from 81,000 to 67,000. Keep in mind, these are "7 weeks of Trump's leadership"...
News Calendar for the US and UK:
On Wednesday, the economic calendar includes two fairly important entries. The impact of the news background on market sentiment is expected to be moderate today.
GBP/USD Forecast and Trading Tips:
Selling opportunities were available following a rebound from the 1.3003 level on the hourly chart, with targets at 1.2931 and 1.2865. The first target has been met; the second has not. Buying opportunities are possible upon a breakout above 1.2931 on the hourly chart with a target at 1.3003. However, given the current sideways movement, the 1.2931 level is not considered strong.
Fibonacci levels are drawn from 1.2809 to 1.2100 on the hourly chart and from 1.2299 to 1.3432 on the 4-hour chart.
You have already liked this post today
*The market analysis posted here is meant to increase your awareness, but not to give instructions to make a trade.
The eagle indicator has reached overbought levels. However, the metal could still reach the high around 8/8 Murray, which represents a strong barrier for gold. Below this area, we could
From what is seen on the 4-hour chart, the EUR/GBP cross currency pair appears to be moving above the EMA (100), which indicates that Buyers dominate the currency pair
With the appearance of Convergence between the price movement of the main currency pair USD/JPY with the Stochastic Oscillator indicator and the position of the EMA (100) which is above
Useful links: My other articles are available in this section InstaForex course for beginners Popular Analytics Open trading account Important: The begginers in forex trading need to be very careful
Useful links: My other articles are available in this section InstaForex course for beginners Popular Analytics Open trading account Important: The begginers in forex trading need to be very careful
From what we see on the 4-hour chart of the Nasdaq 100 index, there are several interesting things, namely, first, the price movement is moving below the MA (100), second
E-mail/SMS
notifications

Your IP address shows that you are currently located in the USA. If you are a resident of the United States, you are prohibited from using the services of InstaFintech Group including online trading, online transfers, deposit/withdrawal of funds, etc.
If you think you are seeing this message by mistake and your location is not the US, kindly proceed to the website. Otherwise, you must leave the website in order to comply with government restrictions.
Why does your IP address show your location as the USA?
Please confirm whether you are a US resident or not by clicking the relevant button below. If you choose the wrong option, being a US resident, you will not be able to open an account with InstaTrade anyway.
We are sorry for any inconvenience caused by this message.


