See also

 27.02.2019 08:38 AM
USD/JPY
On Monday, the yen was able to meet the minimum instruction - it reached the target level of 111.14 - the resistance of the trend line of the daily price channel, but failed to gain a foothold above it and returned to the four-hour chart of Krusenstern. Also, the Marlin oscillator signal line on H4 went down to the negative zone. The reversal divergence is already forming on the daily chart with Marlin. It is also weakly expressed on the four-hour chart.
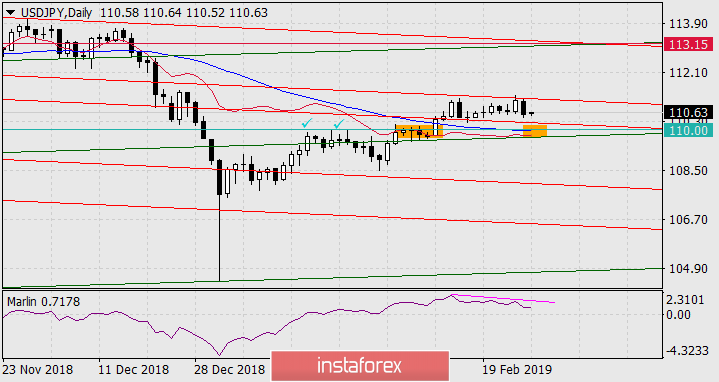
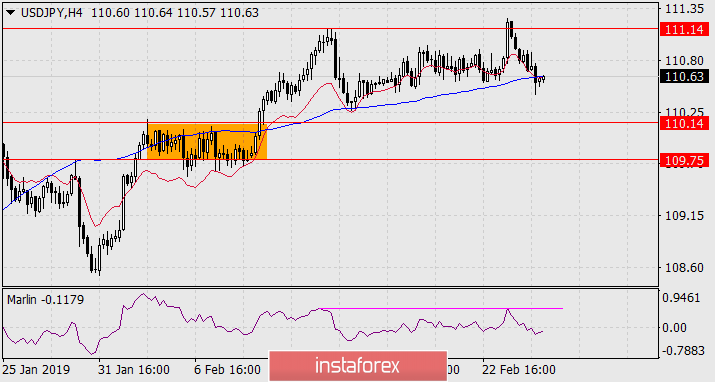
Despite such strong, seemingly reverse signals, they have their weaknesses. First of all, it is a possible reversal of the Marlin signal line from the zero line up on the daily scale. This option implies a price reduction in the consolidation range of February 4-11, 109.75-110.14, approximately to the support of the Krusenstern line of the daily timeframe. At this point, the Marlin indicator and the price from the Kruzenshtern line will turn up. In this scenario, the emerging convergence will be interpreted as weak in fact, corrective, and as a rarefaction of the indicator ahead of further and strong growth.
Another weakness of the signal is the accumulation of technical support in the specified range 109.75-110.14, clearly visible on the daily chart.
The described scenario, with a price reduction in the support range and a further upward reversal, we take as the main one, since the synchronous convergence on the charts of two scales, which is a strong signal, has not yet received market resistance, but also the immaturity of the convergence allows the growth of the quotation today or tomorrow, and consolidating the price above 111.14 opens the way to 113.15.


Your IP address shows that you are currently located in the USA. If you are a resident of the United States, you are prohibited from using the services of InstaFintech Group including online trading, online transfers, deposit/withdrawal of funds, etc.
If you think you are seeing this message by mistake and your location is not the US, kindly proceed to the website. Otherwise, you must leave the website in order to comply with government restrictions.
Why does your IP address show your location as the USA?
Please confirm whether you are a US resident or not by clicking the relevant button below. If you choose the wrong option, being a US resident, you will not be able to open an account with InstaTrade anyway.
We are sorry for any inconvenience caused by this message.


