Actual patterns

Patterns are graphical models which are formed in the chart by the price. According to one of the technical analysis postulates, history (price movement) repeats itself. It means that the price movements are often similar in the same situations which makes it possible to predict the further development of the situation with a high probability.
Relevant patterns by InstaTrade is an easy-to-use service which allows you to be aware of latest changes in the market and react to clues from the market in time. In our service you will always find the latest and most relevant patterns on any pair and any timeframe.
Triple Top
was formed on 30.03 at 23:45:26 (UTC+0)
signal strength 2 of 5
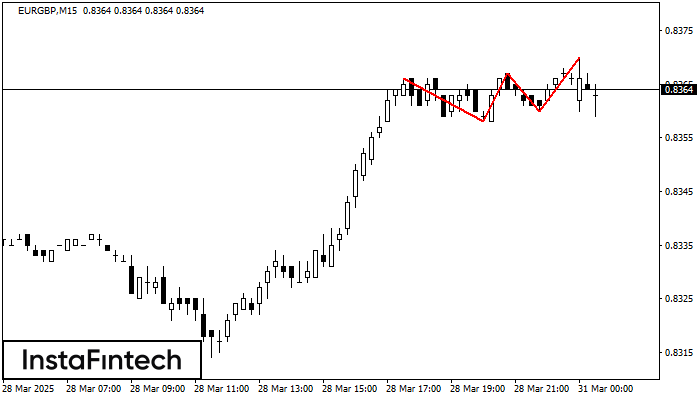
The Triple Top pattern has formed on the chart of the EURGBP M15. Features of the pattern: borders have an ascending angle; the lower line of the pattern has the coordinates 0.8358/0.8360 with the upper limit 0.8366/0.8370; the projection of the width is 8 points. The formation of the Triple Top figure most likely indicates a change in the trend from upward to downward. This means that in the event of a breakdown of the support level of 0.8358, the price is most likely to continue the downward movement.
The M5 and M15 time frames may have more false entry points.
See Also
- All
- All
- Bearish Rectangle
- Bearish Symmetrical Triangle
- Bearish Symmetrical Triangle
- Bullish Rectangle
- Double Top
- Double Top
- Triple Bottom
- Triple Bottom
- Triple Top
- Triple Top
- All
- All
- Buy
- Sale
- All
- 1
- 2
- 3
- 4
- 5
Triple Bottom
was formed on 14.04 at 03:00:24 (UTC+0)
signal strength 2 of 5

Corak Triple Bottom telah dibentuk pada EURNZD M15. Ia mempunyai ciri-ciri berikut: tahap rintangan 1.9498/1.9463; tahap sokongan 1.9409/1.9402; lebar corak adalah 89 mata. Dalam situasi penembusan paras rintangan 1.9498, harga
Carta masa M5 dan M15 mungkin mempunyai lebih banyak titik kemasukan palsu.
Open chart in a new window
Segi Tiga Simetri Menaik
was formed on 14.04 at 02:51:59 (UTC+0)
signal strength 1 of 5

Berdasarkan carta M5, GBPAUD membentuk corak Segi Tiga Simetri Menaik. Sempadan yang lebih rendah bagi corak yang menyentuh koordinat 2.0704/2.0775 di mana sempadan atas merentasi 2.0831/2.0775. Sekiranya corak Segi Tiga
Carta masa M5 dan M15 mungkin mempunyai lebih banyak titik kemasukan palsu.
Open chart in a new window
Double Top
was formed on 14.04 at 02:30:27 (UTC+0)
signal strength 2 of 5
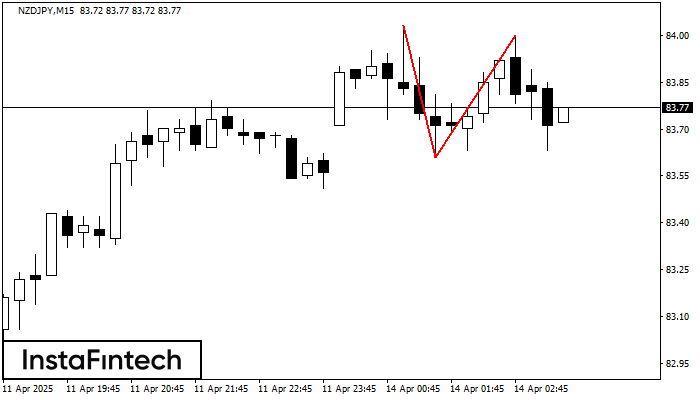
Corak pembalikan Double Top telah dibentuk pada NZDJPY M15. Ciri-ciri: sempadan atas %P0.000000; sempadan bawah 84.03; sempadan bawah 83.61; lebar corak adalah 39 mata. Dagangan menjual adalah lebih baik untuk
Carta masa M5 dan M15 mungkin mempunyai lebih banyak titik kemasukan palsu.
Open chart in a new window