实际模式

模式是通过价格在图表中形成的图形模型。 根据其中一项技术分析规定,历史(价格变动)重演。 这意味着价格变动在相同的情况下通常是相似的,这使得有可能以高概率预测情况的进一步发展。
InstaTrade的相关模式是一款易于使用的服务,可让您了解市场的最新变化并及时对市场线索做出反应。 在我们的服务中,您始终可以在任何货币对以及任何时间范围内找到最新和最相关的模式。
Bullish Rectangle
was formed on 03.04 at 05:24:47 (UTC+0)
signal strength 1 of 5
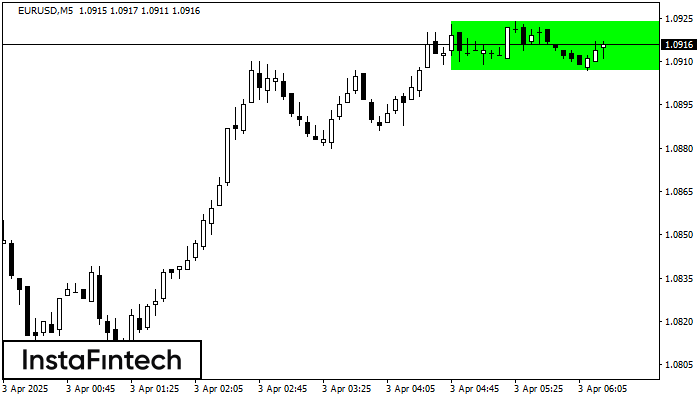
According to the chart of M5, EURUSD formed the Bullish Rectangle which is a pattern of a trend continuation. The pattern is contained within the following borders: the lower border 1.0907 – 1.0907 and upper border 1.0924 – 1.0924. In case the upper border is broken, the instrument is likely to follow the upward trend.
The M5 and M15 time frames may have more false entry points.
- All
- All
- Bearish Rectangle
- Bearish Symmetrical Triangle
- Bearish Symmetrical Triangle
- Bullish Rectangle
- Double Top
- Double Top
- Triple Bottom
- Triple Bottom
- Triple Top
- Triple Top
- All
- All
- Buy
- Sale
- All
- 1
- 2
- 3
- 4
- 5
Teratas Ganda
was formed on 10.04 at 15:00:21 (UTC+0)
signal strength 2 of 5
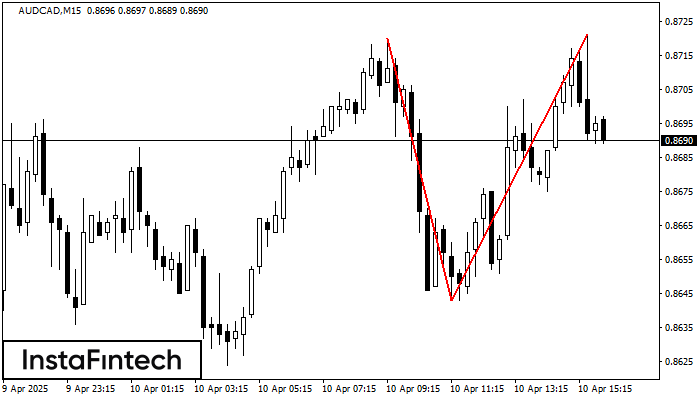
Pada grafik AUDCAD M15 pola reversal Teratas Ganda telah terbentuk. Karakteristik: batas atas 0.8721; batas bawah 0.8643; lebar pola 78 poin. Sinyal: tembusan ke batas bawah akan menyebabkan kelanjutan tren
Rangka waktu M5 dan M15 mungkin memiliki lebih dari titik entri yang keliru.
Open chart in a new window
Persegi Bearish
was formed on 10.04 at 14:40:41 (UTC+0)
signal strength 1 of 5
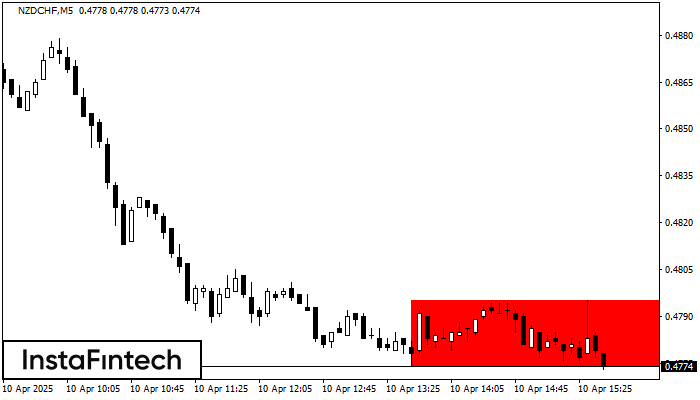
Menurut grafik dari M5, NZDCHF terbentuk Persegi Bearish. Pola menunjukkan kelanjutan tren. Batas atas adalah 0.4795, batas rendah adalah 0.4774. Sinyal berarti posisi jual harus dibuka setelah menetapkan harga dibawah
Rangka waktu M5 dan M15 mungkin memiliki lebih dari titik entri yang keliru.
Open chart in a new window
Persegi Bearish
was formed on 10.04 at 14:40:16 (UTC+0)
signal strength 1 of 5
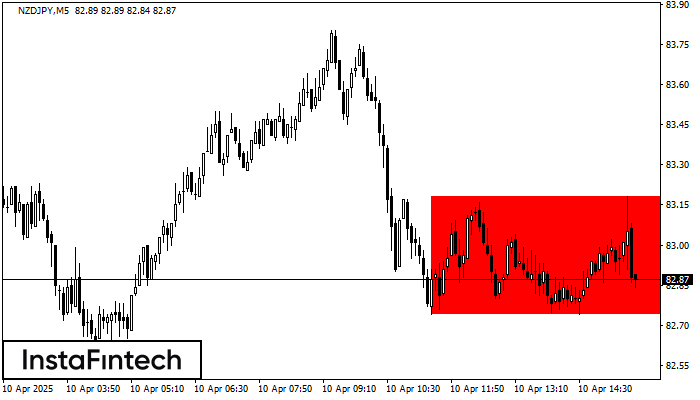
Menurut grafik dari M5, NZDJPY terbentuk Persegi Bearish. Pola menunjukkan kelanjutan tren. Batas atas adalah 83.18, batas rendah adalah 82.74. Sinyal berarti posisi jual harus dibuka setelah menetapkan harga dibawah
Rangka waktu M5 dan M15 mungkin memiliki lebih dari titik entri yang keliru.
Open chart in a new window